Inversion Aversion

The yield curve inverted. So what?
What does it mean, and what should you do?
A yield curve is a plot of interest rates on bonds (typically U.S. Treasury bonds) of various maturity lengths. Some bonds mature in thirty days, some in three months, one year, two years, five years, ten years, on up to 30 years. The yield—or interest rate—for each bond is on the vertical axis, and the maturity is on the horizontal axis. When you connect the dots, a curve is displayed.
Usually, the curve slopes upward because most of the time, longer maturity bonds pay higher interest rates. As you probably know, longer term Certificates of Deposit (“CDs”) usually pay higher interest than short-term CDs. This is because a longer wait to get your principal back entails higher risk. Part of this risk is inflation. Who knows what inflation might be ten, 20, or 30 years from now?
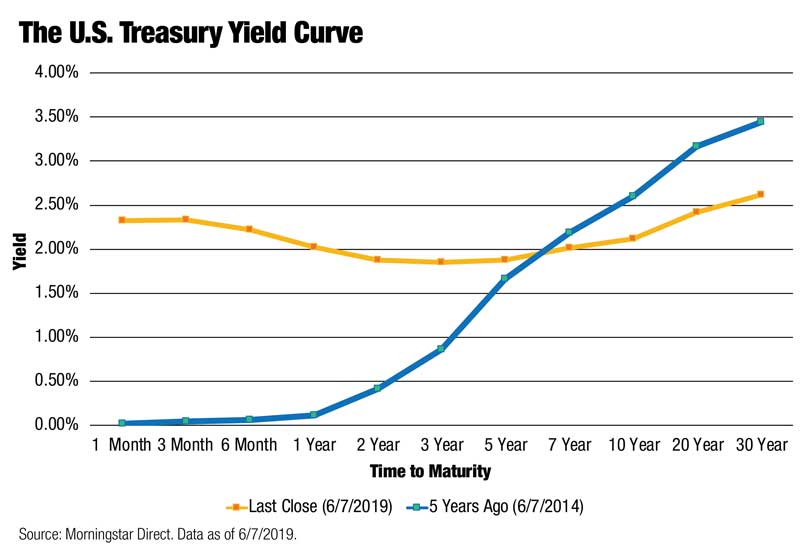
The chart below illustrates the current yield curve’s flatness (gold line) relative to the steeper curve five years ago (blue line).

There have been several periods throughout history when short-term yields were higher than long-term yields. This results in an inverted yield curve. The curve actually slopes downward.
On Friday, March 22, 2019, the yield on 10-year Treasuries dropped below the yield for three-month Treasuries. It reversed course in April, but inverted again on May 23. This was the first time that had happened since August 1, 2006.¹
How does this happen? Three words: Federal Reserve tightening.
When the Federal Reserve (“Fed”) raises interest rates, tightening credit as it has since December 2015, this only affects very short-term interest rates. Longer term interest rates are attributable to inflation expectations and are generally unaffected by Fed moves. Over the past few years, longer term interest rates have held steady and have even come down recently. Thus, short-term yields have been going up, long-term rates have been coming down, and voila’, we experienced an inverted yield curve between the ten-year and the three-month Treasury bonds. This difference in interest rates is also called the “spread.”
It is interesting to note that the spread between 10-year and two-year bonds has not inverted, although it has come very close. But the spread between 10-year and five-year bonds has inverted.
So what?
Yield curve inversions have been a fairly good indicator in the past of coming recessions. And we know that recessions are bad news for businesses, and thus for stock prices. This is why the yield curve inversion has garnered so much press this year.
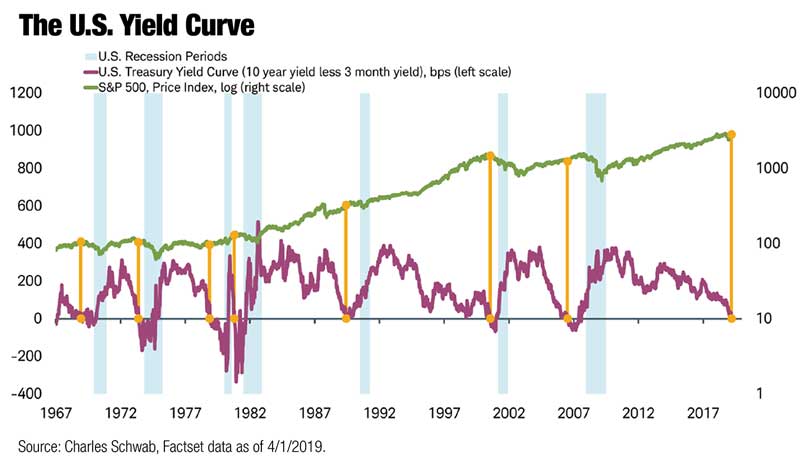
The chart below shows the 1-year/three month inversion points (orange dots) since 1967 and the subsequent recessions (shaded blue areas). Stock market performance (green line) shows a decline during most of those recessions.

However, it is worth noting that while the yield curve did invert this March, it only did so to the point where the three-month Treasury was yielding 0.05% more than the 10-year Treasury for a few days, rather than a deeper, longer-lasting inversion. But since May 23, the yield curve has inverted and this time is a little deeper.²
There was a 10-year/three-month inversion prior to the 2008 financial crisis; the yield curve inverted in January 2006. But the economy did not immediately go into recession, and the stock market did not immediately go down. For 18 months after February 2006, the S&P 500 Index posted a positive return of 18.4% and still had a 17% return 24 months later.³ The recession did not begin until later in 2008, due to factors such as the sub-prime mortgage fiasco. Stocks started going down about 30 months after the inversion.
Prior to that inversion, the Fed had been raising short-term interest rates from 1% in January of 2003 all the way up to 5.25% in 2006. This caused the inversion.
What should you do?
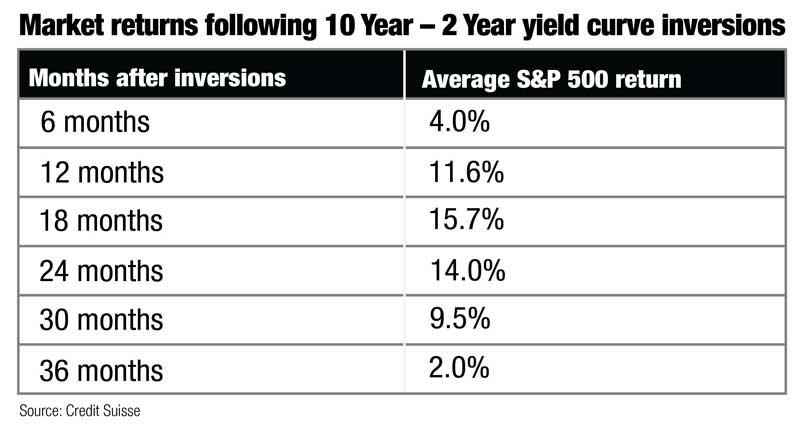
First, do not worry in the short term. The stock market does not immediately go down after an inversion. According to Credit Suisse, stocks rose about 15% on average in the 18 months following inversions. And they didn’t start heading down until about 24 months after the yield curve inverted. “Yield curve inversion won’t signal doom…the lead time is extremely inconsistent, with a recession following anywhere from 14 to 34 months after the curve goes upside down,” according to Jonathan Golub, chief U.S. equity strategist at Credit Suisse. They produced this chart:

Second, understand that we are dealing with a relatively small sample size. There have only been seven previous inversions since 1967 (10-year vs. three-month bonds). While an inverted yield curve has preceded each of these recessions, it has also inverted a few times and no recession followed. The 10-year/two-year bond inversions of 1966 and 1998 are good examples of “false positives;” that is, yield curve inversions followed by a few years of robust economic growth.⁴ There is no actual causal relationship; i.e., an inversion does not actually cause a recession. What we observe is an interesting series of coincidences.
Third, do not make investment decisions based on one economic indicator alone. Many factors go into an economy slowing to the point of recession. For example, the Conference Board publishes leading, coincident, and lagging indexes designed to signal peaks and troughs in the business cycle. Rather than focusing on one indicator in the yield curve, investors are better served with a comprehensive set of indicators. Sets of lagging, coincident, and leading indicators can position investors to confirm trends in past data, reaffirm that these trends are continuing, and determine if they should be expected to continue into the future.
Fourth, remember the definition of a recession: two consecutive quarters of negative GDP (Gross Domestic Product) growth. Over the past few years, GDP has actually been going up, at a higher positive rate than during the previous ten years. Fidelity International is among those anticipating a pick-up in growth later this year. Goldman Sachs strategists wrote that “recession risk remains somewhat low…” They added, “Equity and risky assets in general can have positive performance with a flat yield curve.”
Finally, the inversion must persist for several months. Just because the yield curve inverts briefly, this does not portend gloom and doom in the short term. The recent inversions of March and May have not persisted, yet. And on June 4, 2019, Federal Reserve Chairman, Jerome Powell, indicated that the Fed would be open to reducing short term interest rates.⁵
All of that said, we should not ignore the yield curve. We should be cognizant of it but also be vigilant in understanding GDP growth trends, as well as other leading economic indicators.
It is important to control what you can control. Your asset allocation is the most important investment decision. And this should be driven by your goals and objectives. Another major factor in changing goals and objectives is time horizon. In culmination, these factors allow you and your advisor to assess the level of risk you are comfortable with and design your portfolio accordingly. If any of those factors have changed, you should discuss with your advisor and consider re-assessing the level of risk you are comfortable taking.
If you have evaluated your investment portfolio, confirmed your risk tolerance, and re-balanced your asset mix, there is little else you need to do. Staying disciplined allows you to ride out downturns better than those who throw discipline to the wind. Panic is never an effective investment strategy.
¹ Schwab. “Market Perspective: Market Madness.” 3-20-19
² Yahoo Finance. “Yield Curve Inverted Again. Will Gold Shine Now?” Arkadiusz Sieron 6-5-19
³ CNBC.com. “Bonds are flashing a huge recessions signal—here’s what happened to stocks last time it happened.” Yun Li 3-22-19
⁴ Bob Veres. “Time to Panic?” 1-28-16
⁵ New York Times. “Stocks Jump as Fed’s Powell Suggests Rates Could Come Down.” 6-4-19
