Market Outlook: Focus on the Fundamentals

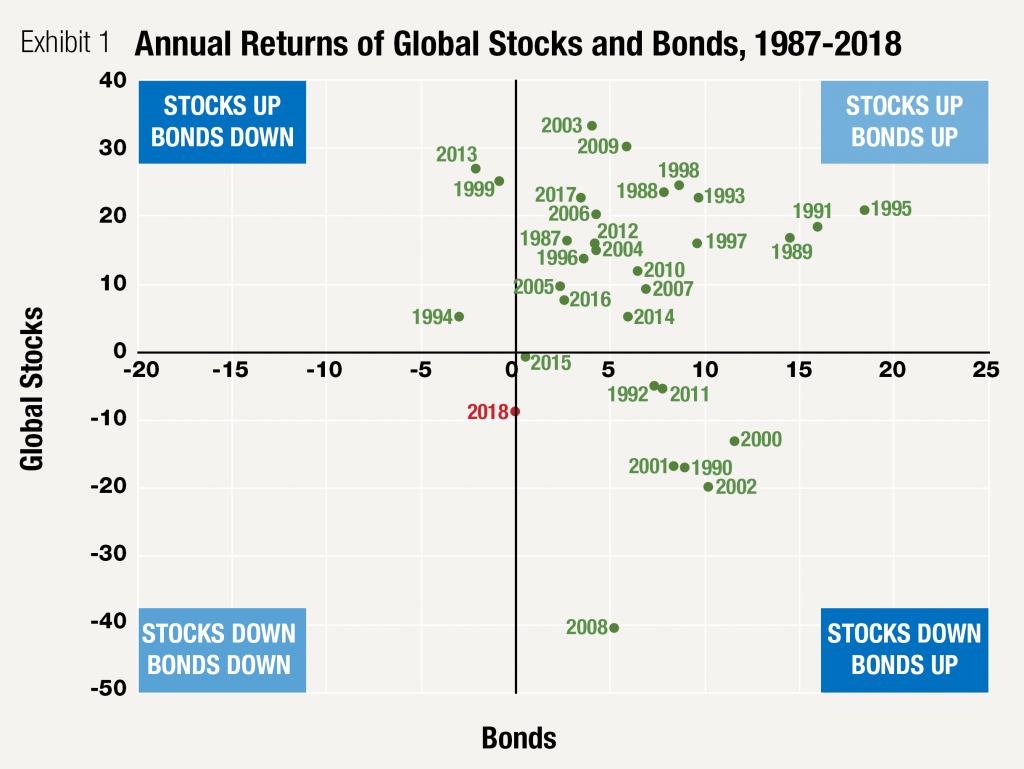
The start of 2018 appeared promising with the welcomed tax reform, strong corporate earnings, solid economic growth, low interest rates, and controlled inflation. The market outcome, however, was disappointing to say the least, with both stocks and bonds struggling to find positive returns (see Exhibit 1). When does that ever happen?
In looking back over the past 32 years (as far back as the world stock index has data), no other year has produced this result. There isn’t one perfect explanation for this, but various worries throughout the year regarding trade, interest rates, oil, and other concerns resulted in increased volatility and markets losing confidence.

Source: Morningstar Direct. Global Stocks: MSCI World Index NR, Bonds: U.S. Aggregate Bond Index. Data as of 12/31/18.
The probability for 2019 experiencing the same outcome is low. There are numerous factors that will play into how markets perform this year, but no one can predict how they will all intertwine. With uncertainty about the end of the U.S. monetary policy tightening cycle (see The Fed’s FOMO), the outcome of any trade deal with China, the stability of oil prices, and the potential slowdown in corporate earnings, markets may continue into 2019 with similar volatility.
However, volatility doesn’t mean we are headed into a recession. Typical drivers of recessions are not what appear on the near-term horizon. There are no obvious asset bubbles, there is relative stability in corporate earnings (just growing at a slower pace than in recent years), and consumers’ balance sheets are generally healthy, among other favorable economic signposts.
The Fed’s FOMO
2018 wound down with four rate hikes in the books (ending at a range of 2.25% to 2.50%) for a total of nine rate hikes since 2015. The Fed’s guidance is for two more rate hikes in 2019 (targeting a rate just below 3%). The stated focus for rate hike decisions is price stability (inflation) and employment, but financial market stability is always on the forefront of the Fed’s mind. If economic data shows a continued growing economy, low unemployment, and wages continuing to rise, the Fed may need to follow through with the planned rate hikes. The Fed’s fear of missing out (FOMO) means they are always on watch taking in every data point so they do not miss any important signals in the economic landscape.
When the Fed signals the rate hikes are over, subjects such as companies wanting to borrow money or potential home buyers needing mortgages will be pleased to continue borrowing at relatively low rates. However, it would also mean that bank deposit accounts will cease trending higher and investors must still look to capital markets to invest for return.
Looking Beyond 2019
While the outcome of 2019 market performance is anyone’s guess, the focus for investors should remain on longer-term outcomes. In order to help clients invest to meet their goals, we need reasonable estimates of future returns to use as inputs for our financial plan modeling. The modeling provides the range of possibilities for a client’s portfolio given their specific circumstances. For example, it can help answer questions such as, “What if the market drops in the early years of my retirement?” or “What if I earn less than the expected rate of return from now until I retire?” When investors understand the range of possible outcomes for a portfolio over various timeframes, it becomes easier to stick with the plan and not let short-term market volatility get the best of them.
Savant’s methodology for estimating long-term asset class returns (20 years) is based on the evidence that fundamental factors such as today’s valuations and interest rates give us information about future returns. Valuations, for example, tell us if stocks today are “cheap” or “expensive” which has an impact on the long-term return. Stocks that are cheap today historically have had higher subsequent long-term returns, based on our research as well as other academic research (see What Do Valuations Tell Us?). We also can use today’s yield curve to help estimate bond returns. These market expectations are important to consider as we build portfolios for investors with varying risk appetites, return goals, and time horizons.
Currently, a few of our long-term estimates* are:
- 7.8% U.S. large cap stocks
- 8.7% International developed large cap stocks
- 9.1% Emerging markets stocks
- 4.5% Intermediate-term bonds
Given current economic conditions and asset valuations, investors may benefit from diversifying their portfolios by holding international stocks, which we estimate have a more favorable forward-looking risk/return benefit than U.S. stocks today.
What Do Valuations Tell Us?
The good news as we head into 2019 is that you can buy at very good prices. The extent of the bargain depends on the market.
As stated earlier, key drivers of long-term stock returns are company earnings and the prices investors are paying for those earnings. Many factors will always be present and cause short-term noise in markets. However, the evidence has shown that low prices for stocks today can result in higher expected returns in the future. Or vice versa… high valuations or prices today can result in lower expected returns in the future (see Savant’s white paper “Forward Looking Returns” for details).
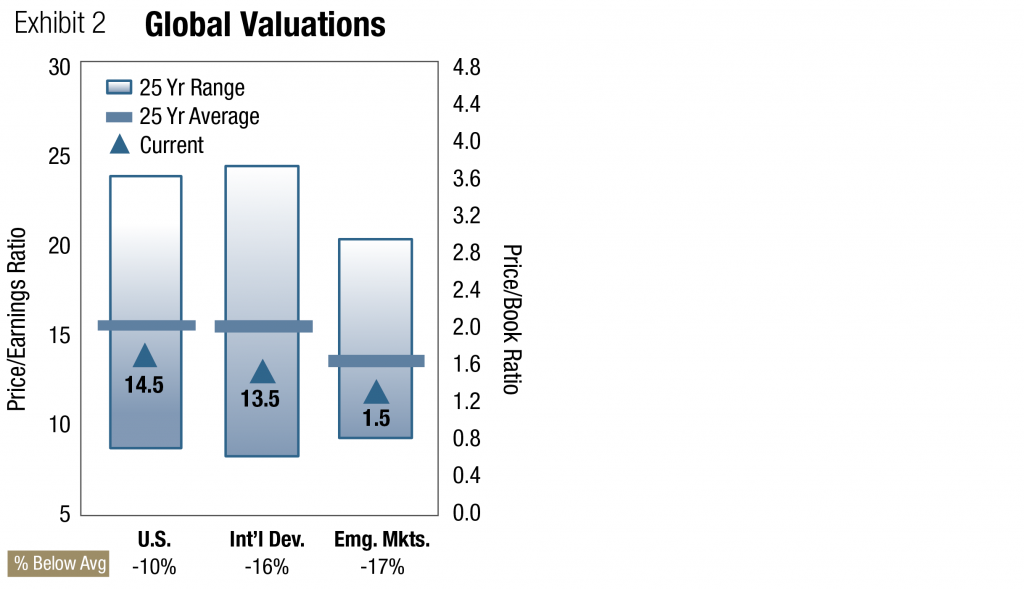
Exhibit 2 provides a quick look at where valuations are today across global stock markets. The short answer is that stock prices are favorable today relative to their earnings. In the U.S., the valuation is slightly below the 25-year average, but outside the U.S., valuations are 16-17% below the 25-year average. For many investors, regular monthly 401(k) contributions or ongoing investments into markets are being funded at historically inexpensive prices.

J.P. Morgan Asset Management, Guide to the Markets – U.S. Data are as of December 31, 2018. Valuations refer to NTMA P/E for U.S. and international developed markets and P/B for emerging markets. Valuation and earnings charts use MSCI indices for all regions/countries, except for the U.S., which is the S&P 500. All indices use IBES aggregate earnings estimates. 25-year averages are: U.S. 16.1, Int’l Developed 16.1, Emerging Markets 1.8.
Takeaway
While we cannot control what the market does from year to year, we can use long-term expectations for returns and volatility to provide information in the financial planning process for clients. This information serves to help add confidence that the plan is working, despite the uneasiness brought on by market volatility. The financial planning inputs will change over time, meaning expected returns, expected inflation, investor income/spending, tax rates, and other inputs need to be updated. This illustrates the important point that financial plans need to be updated regularly, which is a significant part of what we do at Savant every day.
*Source: Savant Analysis and Morningstar Direct. Savant’s 20-year (long-term) asset class return estimates as of 12/31/2018 are hypothetical and were developed using various methodologies. The asset class return estimates do not factor in a fee estimate for advisory and fund expenses. The asset class indices used in the forward-looking return calculations are shown on the next page.
Market return data from Morningstar Direct. Indices used (unless otherwise indicated): World Stock-MSCI ACWI IMI Index, U.S. Large Cap-S&P 500 Index, U.S. Large Value-MSCI U.S. Prime Market Value Index, U.S. Small Cap-Russell 2000 Index, U.S. Small Value-MSCI U.S. Small Value Index, Int’l Large-MSCI EAFE Index, Int’l Large Value-MSCI EAFE Value Index, Int’l Small-S&P EPAC Small Index, Int’l Small Value-S&P EPAC Small Value Index, Emerging Mkts-MSCI Emerging Markets Index, TIPS-ICE BofAML U.S. Treasury Inflation-Linked Securities Index, Short Bonds-BBgBarc U.S. Govt/Credit 1-3 Yr Index, Interm Bonds-BBgBarc U.S. Aggregate Bond Index, Int’l Bonds-JPM GBI Global Ex US Hdg Index, Global REITs-S&P Global REIT Index, Commodities-Bloomberg Commodity Index, Managed Futures-Credit Suisse Mgd Futures Liquid Index, Reinsurance-Swiss Re Global Cat Bond Index. Some indices have been appended prior to their inception date with similar indices in order to construct a full data set for time period.
Savant Capital Management is a Registered Investment Advisor. This information is not intended as personalized investment advice. The index returns herein assume reinvestment of all dividends and interest and do not reflect fees or expenses. Index portfolios reflected in this publication are not representative of any actual client returns. Savant’s marketing material should not be construed by any existing or prospective client as a guarantee that they will experience a certain level of results if they engage the advisor’s services. Please remember that past performance is not indicative of future results. Different types of investments involve varying degrees of risk, and there can be no assurance that the future performance of any specific investment, investment strategy, or prod-uct (including the investments and/or investment strategies recommended or undertaken by Savant Capital Management), or any non-investment related content, made reference to directly or indirectly in this handout will be profitable, equal any corresponding indicated historical performance level(s), be suitable for your portfolio or individual situation, or prove successful.
