Small but Mighty: International Small Value Stocks

When investors think about the best performing stocks of the last 50 years, they are naturally drawn to the names we know best. From the high-flying FAANG stocks (the five most popular and best-performing American technology companies) to the Nifty Fifty of the 1970s, the most popular U.S. large-cap companies are often assumed to also be the best investments.
While investors in U.S. large-cap stocks have certainly done well over the past 50 years, Figure 1 shows that focusing solely on the most well-known companies in U.S. large-cap would have meant missing out on numerous stock asset classes that outperformed U.S. large-cap over this time period.
Most notably, of these nine core stock asset classes, international small value stocks stand out as providing the highest returns over the past 50 years. This warrants a deeper dive to explore why these stocks have delivered such strong performance in the past and what lessons investors can take away as we position portfolios for the future.
As the name implies, international small value stocks are generally defined as companies in developed markets outside the United States with a market capitalization below $5 billion and a lower relative valuation compared to their peers. International developed markets include countries like Japan, Australia, Germany, the UK, and Canada, among others. For most U.S. investors, international small-value stocks can be easily overlooked because they likely have never heard of the companies in that category.
It is fair to wonder why you might want to own lesser-known companies that conduct business in distant places. Simply put, international small-value stocks are an important part of a diversified portfolio. International small-cap stocks are roughly a $3 trillion asset class made up of more than 4,000 companies which comprise a meaningful part of the global equity investment universe (Figure 2).
More importantly, international small-cap stocks have historically offered strong absolute and risk-adjusted returns as well as diversification benefits when used to complement large-cap stock allocations. Within that international small-cap slice, value stocks are relatively less expensive when compared to their growth counterparts. A dedicated allocation to the value portion of international small-cap allows investors to target the value factor – one of the most well-established investment factors with a demonstrated return premium across many different markets.
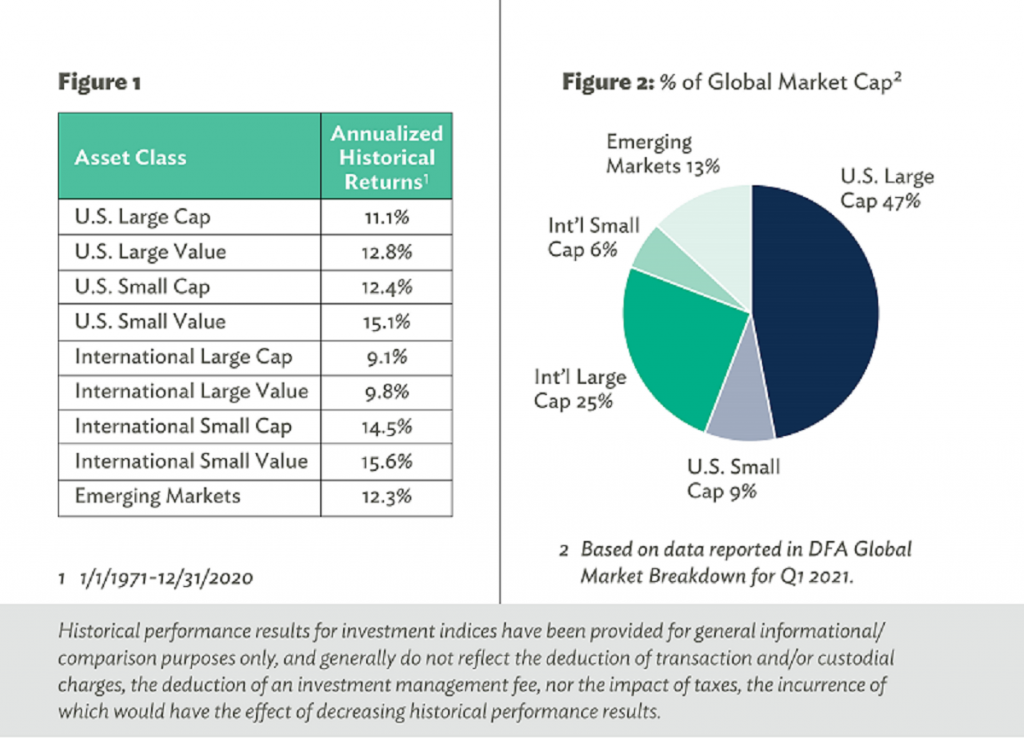
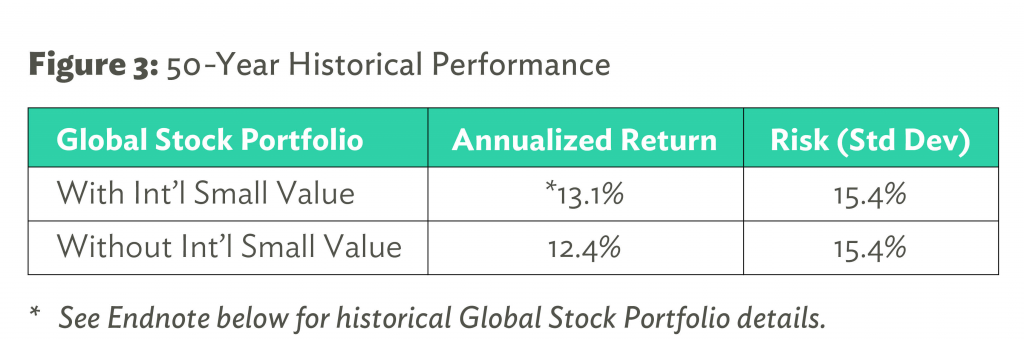
Figure 3 compares the historical performance of a globally diversified index portfolio with and without a 10% allocation to international small value stocks. The portfolio with international small value stocks outperformed the portfolio without by more than half a percent per year with essentially the same amount of volatility. This is compelling evidence of the benefit that allocating to international small value stocks has had for portfolios in the past. But past performance is no guarantee of future results. The next section will examine the case for continuing to allocate part of your portfolio to international small value.
At Savant, we strive to be conscious of past performance but are focused on the future expected performance when making portfolio allocation decisions. One element of our decision-making process is our expected return methodology. While evidence has shown that it is virtually impossible to predict stock market returns over the short term, several factors can be used to help set realistic long-term return expectations.
Savant’s expected return methodology utilizes fundamental factors such as valuations, dividend yields, and interest rates to calculate a 20-year expected return for each asset class to help inform asset allocation decisions. These projections are updated regularly and while they shouldn’t be viewed as a precise prediction, we believe they can help provide actionable insights for constructing long-term portfolios.
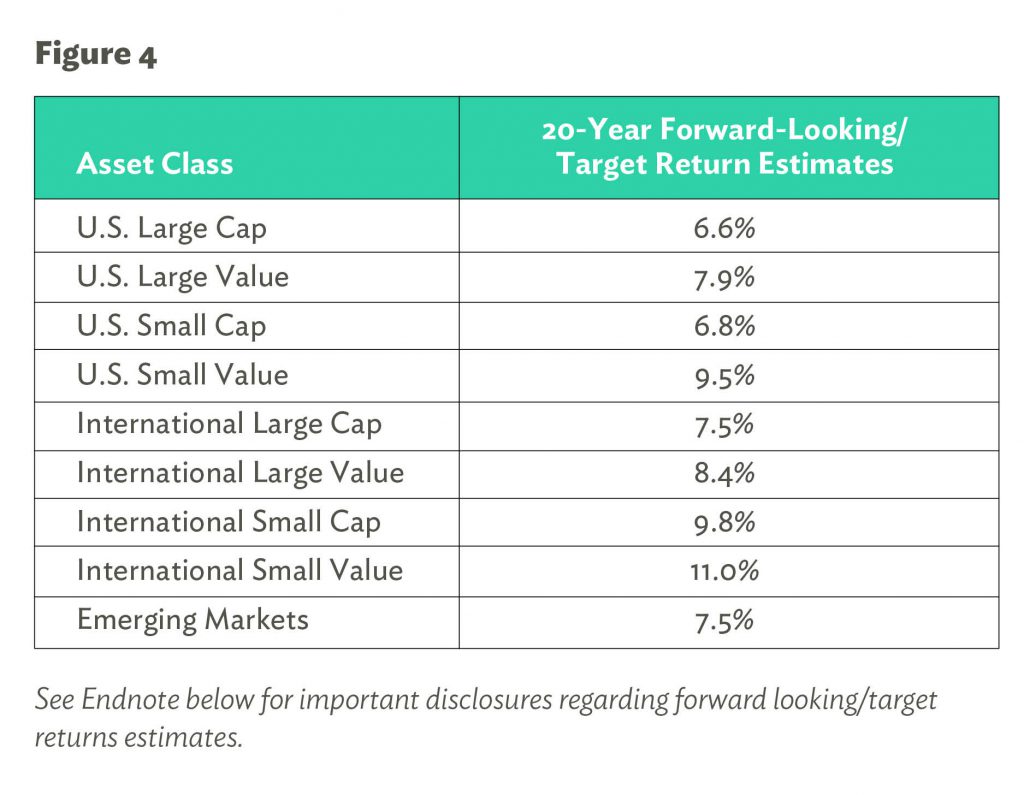
Figure 4 shows Savant’s most recent expected returns for the same core stock asset classes shown earlier. Two key takeaways from this analysis are that expected returns are lower than historical returns across the board, and international small value stocks are still expected to offer the highest returns. This is primarily due to more attractive valuations of international stocks when compared to U.S. stocks and the strong empirical evidence that lower starting valuations (undervalued stocks as measured by fundamentals such as price/earnings or price/book ratios) are correlated to higher long-term returns.
If the next two decades turn out to be a lower absolute return environment, it becomes even more important for investors to optimize for expected returns and maintain proper diversification to have the best chance of reaching their financial goals. Through an asset allocation lens, it becomes clear that international small value stocks should be an integral component of globally diversified portfolios in the years to come.
In summary, international small value stocks have played an important role in portfolios over the past 50 years by providing strong returns and diversification benefits to global investors. Based on current fundamentals, there is evidence that supports the argument for allocating a portion of your investment portfolio to international small cap. Despite its relative anonymity, this asset class has shown its value and serves as a reminder that investors can benefit from having a global mindset and utilizing an evidence-based approach that accounts for more than just brand-name recognition.
Endnote: The asset class forward-looking return/target return estimates in Figure 4 are hypothetical and have inherit limitation, including: 1) the portfolio results do not reflect the results of actual trading using real assets, but are achieved by means of the proactive application of each but were achieved by means of the proactive application of each referenced portfolios, certain aspects of which may have been designed with the benefit of hindsight.
Asset classes represented by the following indexes: U.S. Large Cap-CRSP U.S. Total Market (Appended); U.S. Large Value- Dimensional U.S. Large Value; U.S. Small Cap-CRSP Deciles 6-10; U.S. Small Value-Dimensional U.S. Small Value; Int’l Large Cap-MSCI EAFE NR; Int’l Large Value-MSCI EAFE Value NR; Int’l Small Cap-Dimensional Int’l Small Cap; Int’l Small Value-Dimensional Int’l Small Cap Value (Appended); Emerging Markets-MSCI Emerging Markets (Appended).
Allocations used for historical global stock portfolio performance (with and without international small value): U.S. Large Cap (23%), U.S. Large Value (23%), U.S. Small Cap (5%), U.S. Small Value (9%), Int’l Large Cap (6%, 13%), Int’l Large Value (5%, 8%), Int’l Small Cap (7%), Int’l Small Value (10%, 0%), Emerging Markets (12%).
Indices are unmanaged, do not reflect fees and expenses and are not available as direct investments. Returns are calculated in U.S. dollars and reflect the reinvestment of dividends and other earnings.
 Jonathan J. Fuller
Manager of Portfolio Strategy
Jonathan J. Fuller
Manager of Portfolio Strategy