Maybe This Bull Market Is Young

The S&P 500 has doubled since the lows in March of last year. We achieved 55 new all-time highs this year; the previous record of 77 new all-time highs in 1995 may be within reach.
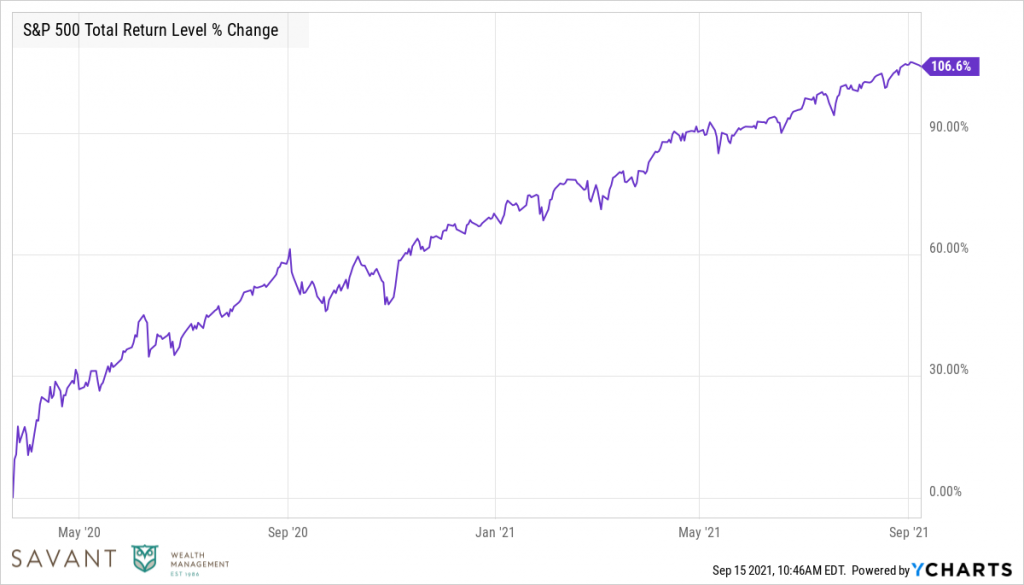
Source: Ycharts. March 2020 – September 2021.
In the process, certain stocks and parts of the market have become expensive. Nearly 25% of U.S. stocks have a price-to-sales ratio greater than 10, the highest level since 2000, a year investors don’t remember with affection.
Percent of U.S. Stocks Trading Over 10x Price/Sales
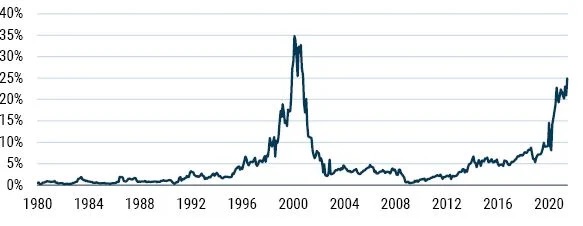
Data from 1/1980-6/2021 | Source: GMO, Compustat
Many prominent investors – Leon Cooperman, Michael Burry, Jeremy Grantham, and Jeff Gundlach, among others – have raised red flags on this market. Without attributing quotes directly, here is a cross-section of opinions:
- “I have no doubt that we are in a raging mania in all assets”
- “Greatest speculative bubble of all time”
- “Fully fledged epic bubble”
- “Anything other than very over-valued versus history is just to be ignorant of all the metrics valuation”
In casual conversations, “we need a market correction” has become commonplace. While anecdotal, this phrase seems to have replaced “we’ll probably retest the lows” from last year after the market began its ascent.
To be fair, a market correction could be healthy. The largest decline from an all-time high this year has been a little more than 4%. Historically, the average intra-year drawdown has been closer to 12%.
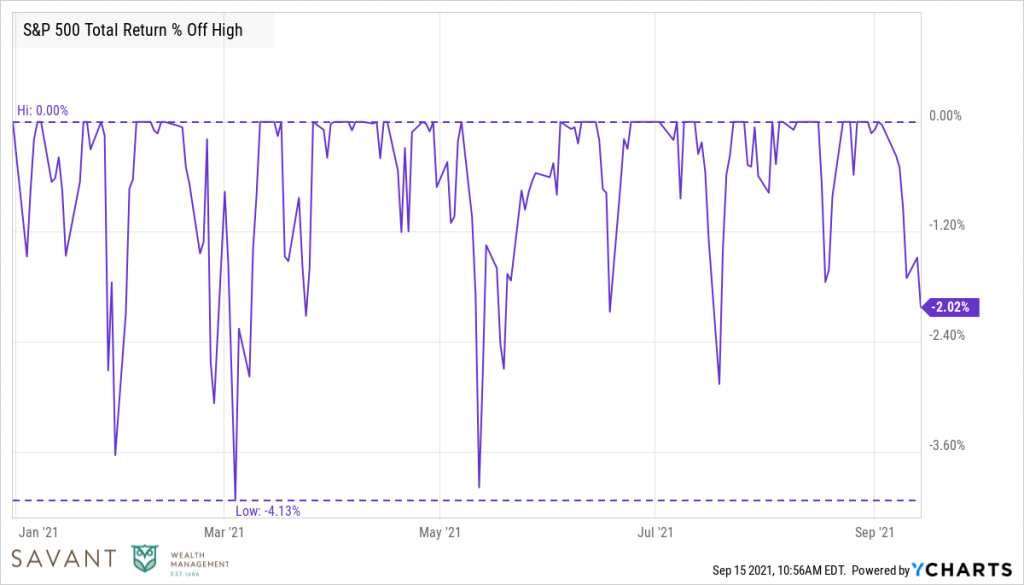
Source: Ycharts. January 2021 – September 8, 2021.
However, the part that is a bit curious is we can still see one of the sharpest declines in market history in our rearview mirror. Over a four-week period, last March the S&P fell more than 30% before the remarkable recovery that we’re experiencing today.
Many who missed the rally like to play roulette with different arguments about why the market is built on a weak foundation. These arguments often come in the form of a “debt-fueled binge” or various combinations of Fed actions that, have in effect, robbed Peter to pay Paul (read: borrowing from the future).
While this could be true, we should acknowledge some counterfactuals as well. This bull market isn’t even 18 months old. Since World War II, the average bull market has lasted about five years or 65 months.
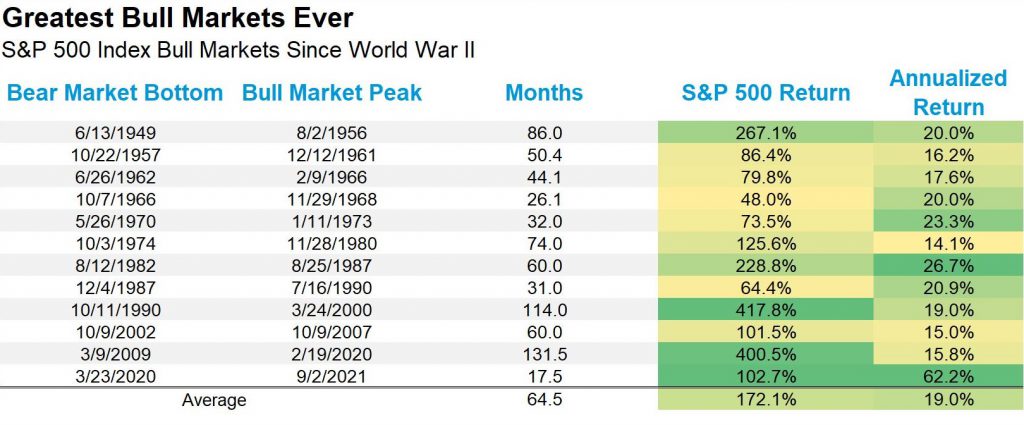
Source: LPL Research, FactSet 09/08/2021. All indexes are unmanaged and cannot be invested directly. Past performance is no guarantee of future results.
A narrative prior to the COVID-19 crash was the market was dominated by a few technology stocks. Exxon Mobil, a company left for dead last year, is outpacing both Amazon and Apple this year.
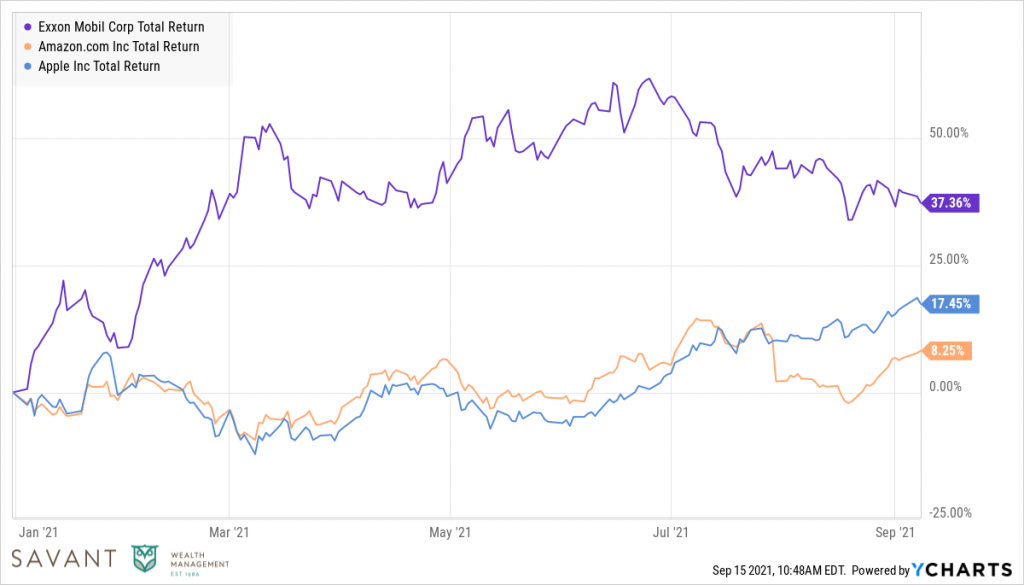
Source: Ycharts. January 2021 – September 8, 2021.
More broadly, energy, financial, and real estate stocks are all outpacing technology stocks so far this year.
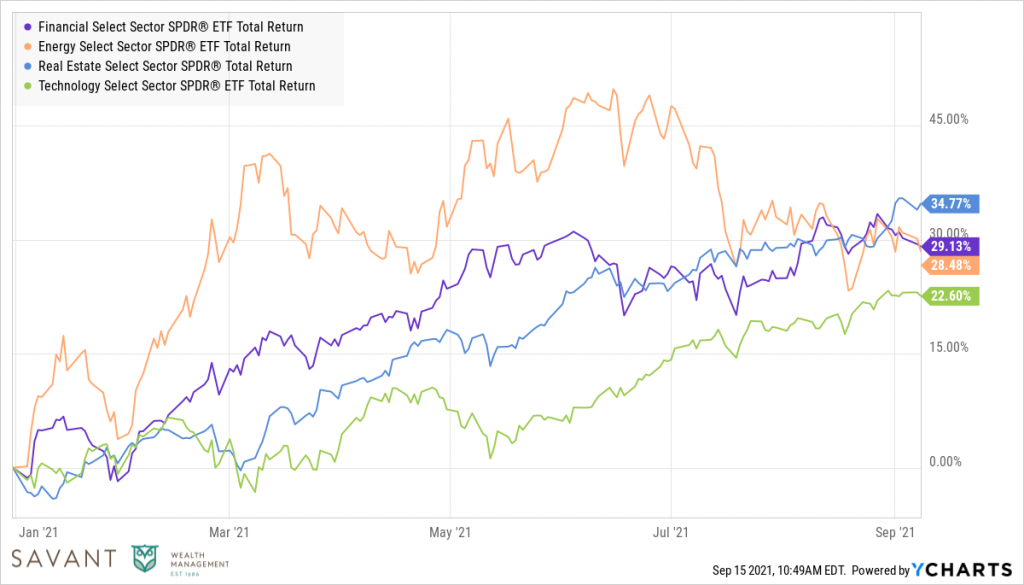
Source: Ycharts. January 2021 – September 8, 2021.
The fact that the market’s gains are more distributed than in recent years provides a solid foundation, making the market less vulnerable if one sector underperforms.
And it’s easy to focus on the market’s all-time highs and forget that everything within the index isn’t winning. For example:
- Zoom, a staple of everyday life, is down 35% from its all-time high.
- Zillow, a real estate platform, is down 50% while the real estate market is on fire.
- Coinbase, a cryptocurrency platform, is in bear market territory while Bitcoin and other cryptocurrencies hover at all-time highs.
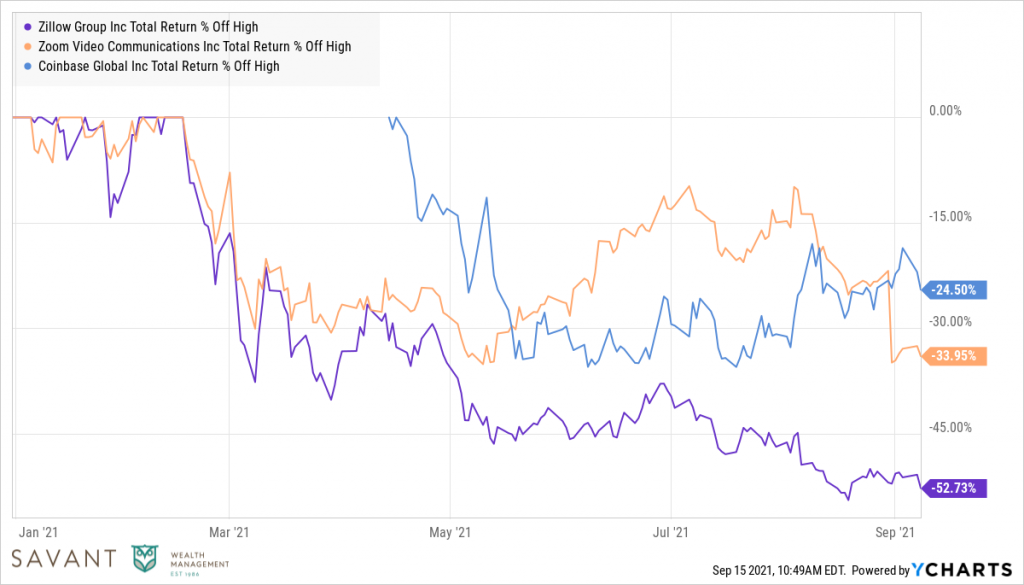
Source: Ycharts. January 2021 – September 8, 2021.
The market continues to separate winners from losers, a healthy sign.
With football starting back up, we’re reminded of former New York Jets head coach Herm Edwards. After a good start to a season, the New York media asked him if the winning results should mostly be attributed to playing a schedule of bad teams. His response:
“Uh Hello?! You play to win the game!”
Maybe this market is beating easy opponents. But there are no apologies necessary for winning. In investing, we believe the only way to win the game is to stay in it, during the good times and the bad.
This is intended for informational purposes only and should not be construed as personalized investment advice.
The securities identified and described do not represent the securities purchased, sold or recommended by Savant. The reader should not assume that an investment in the securities identified was or will be profitable. All investment strategies have the potential for profit or loss. Past performance may not be indicative of future results.