Reasons for Optimism?

The first six months of the year were a whole lot of terrible.
The S&P 500 finished down 20.6%, its worst start to a year since 1970. The NASDAQ, down 28.6%, had its worst first half since the dot-com crash. Non-U.S. stocks, International Developed, and Emerging Markets struggled as well, all down roughly 20%.
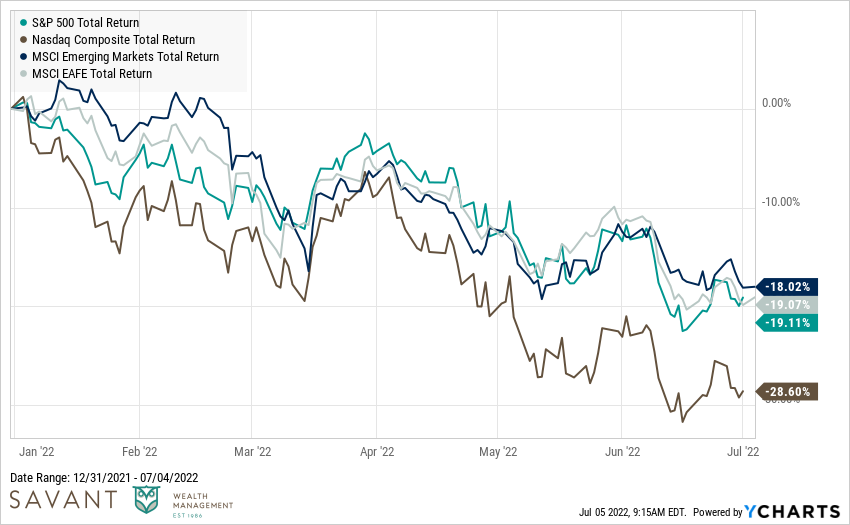
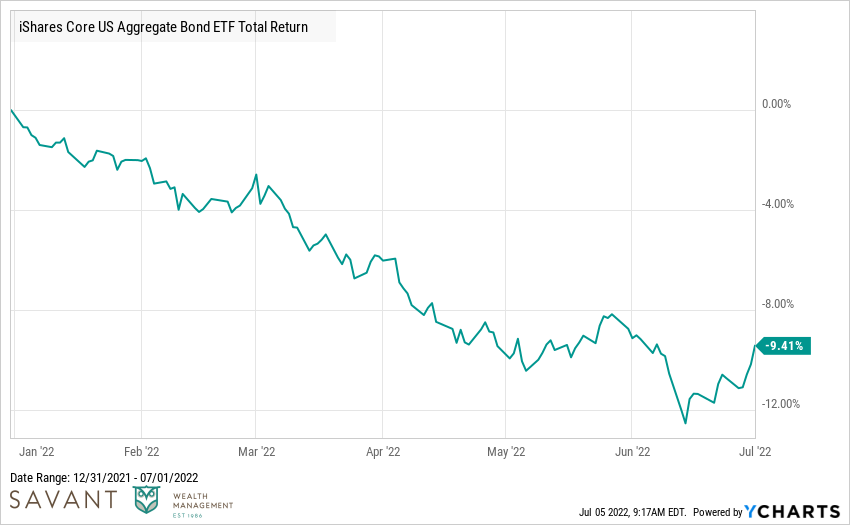
Bonds didn’t provide the usual buffer, down 9.5% for the year through June.
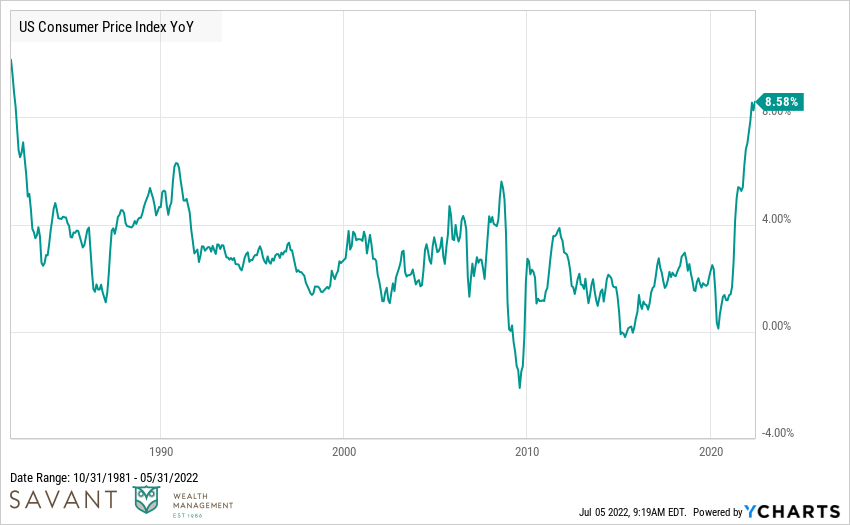
Public Enemy #1, inflation, has sucked the oxygen out of the room. Inflation is at its highest level since the early 1980s.
“But other than that, how was the play, Mrs. Lincoln?”
The good news? There are reasons to believe the second half won’t repeat the wealth destruction of the past six months.
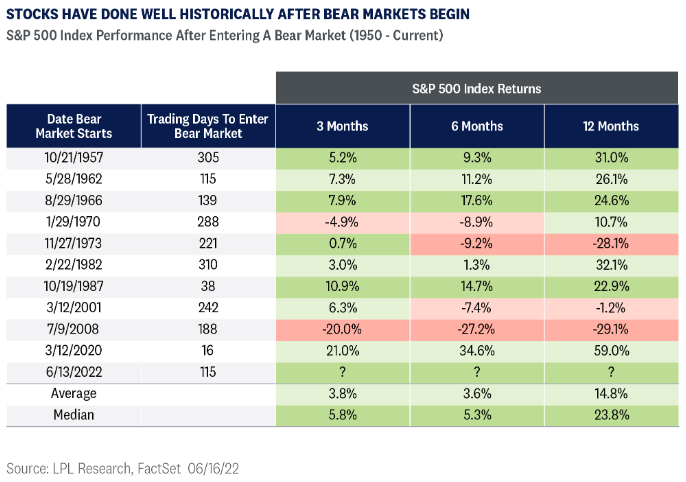
Looking at every bear market since 1950, the average one tends to last 11 months. Bear markets are painful, but they tend to come and go as swiftly as a tornado.
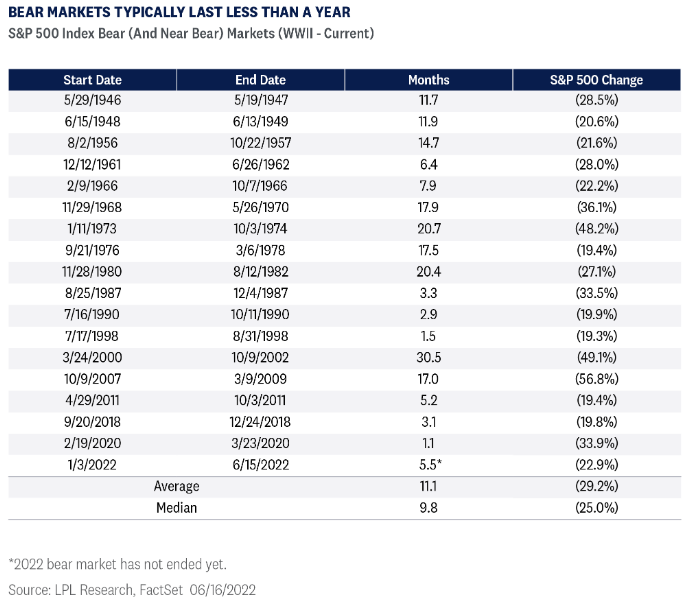
Using the same data above, we know the average bear market has seen the S&P 500 fall roughly 29%. This suggests that if the current bear market follows historical patterns, stocks could drop another 5% plus or minus. But if you factor in the current economic situation (i.e., strong consumer balance sheets, good job market, and low interest rates versus the past), you could make the case that this bear market could potentially be shallower than others.
After a bear market, the stock market historically generates some of its best performances. The average one-year return after a bear market has been 15% historically.
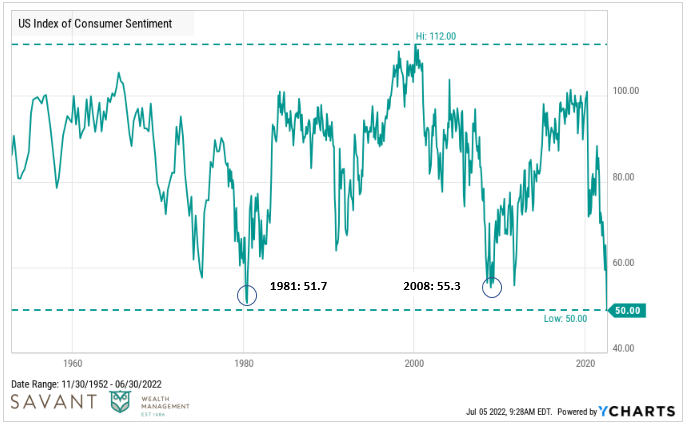
Consumer sentiment – currently sitting at 50.0 – is the worst reading in the history of the survey, dating back to 1952. During the depths of the Global Financial Crisis (November 2008), the lowest dip was 55.3. More negativity is priced in today than back in 2008!
Markets tend to be resilient over time – with one of the best illustrations of that fact below. Over any five or 10-year period, we believe the odds are stacked in your favor.
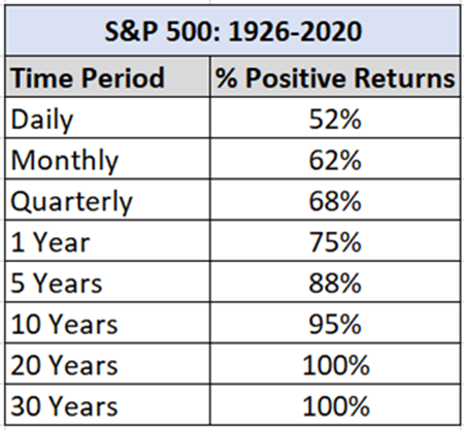
Source: (Vanguard: data via Fama-French data series)
Inflation has likely been the biggest driver of falling prices, and cracks are beginning to emerge in the “higher inflation for longer” foundation.
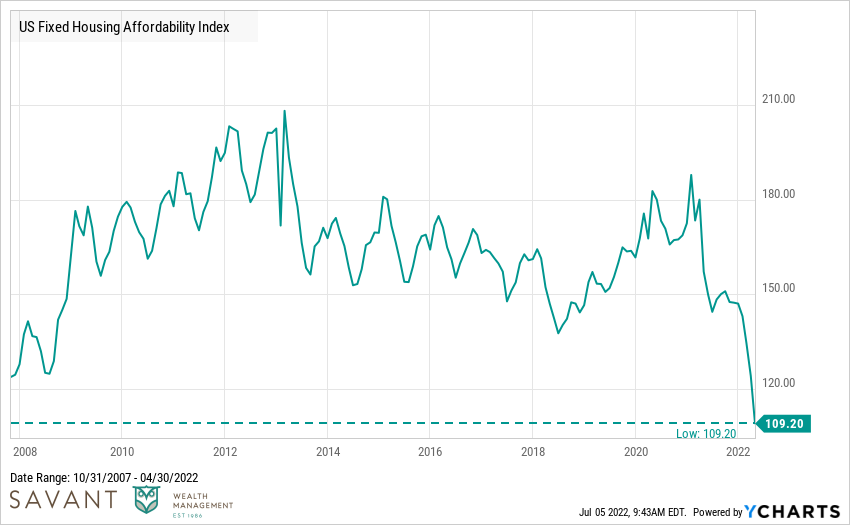
A 30-year mortgage has gone from 2.6% to nearly 6.0% over the past 18 months; this will likely put a dent in the rapid appreciation seen in housing markets.
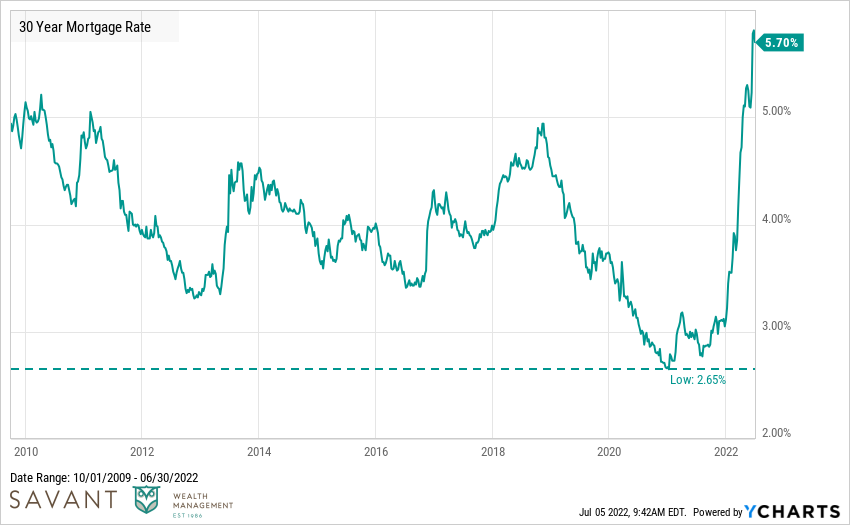
Housing affordability is now at its lowest level since 2007.
Used car prices are down 6% over the last 6 months. In 2020, car prices were one of the first areas to spike higher, proving to be a leading indicator of the inflation spike that followed. Hopefully, this decline can prove to be a leading indicator of lower inflation rates in the future.
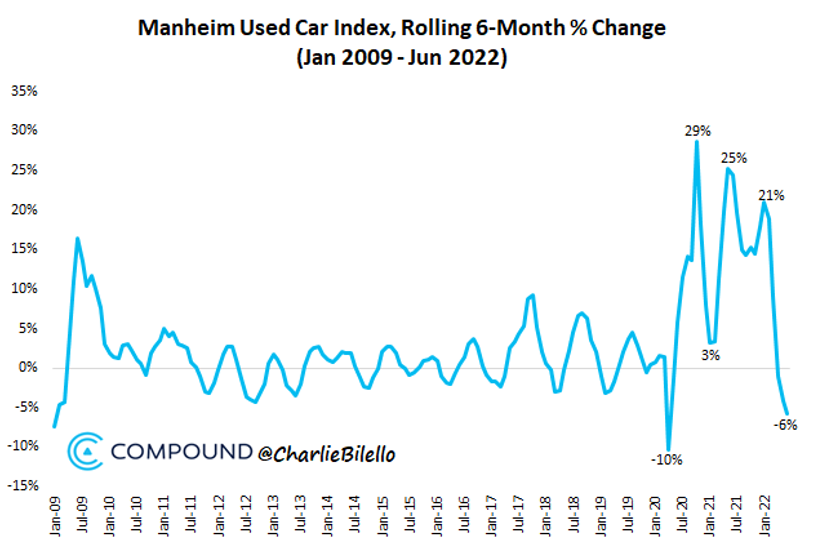
Source: Compound Advisors
Valuations across the U.S. market spectrum reflect cheaper prices. Earnings can always go lower, but valuations are significantly more compelling now than they were 18 months ago.
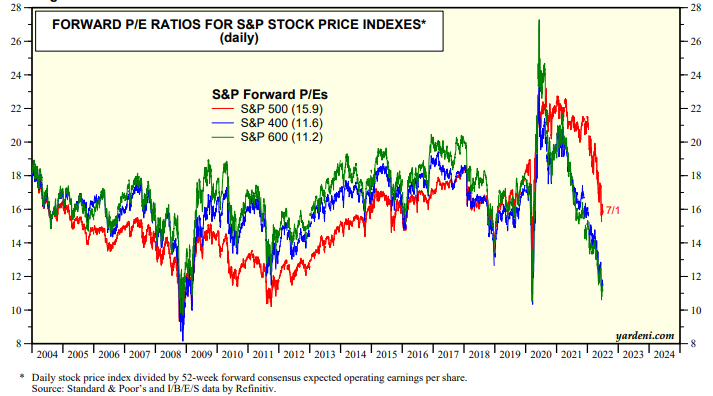
Source: Yardeni Research
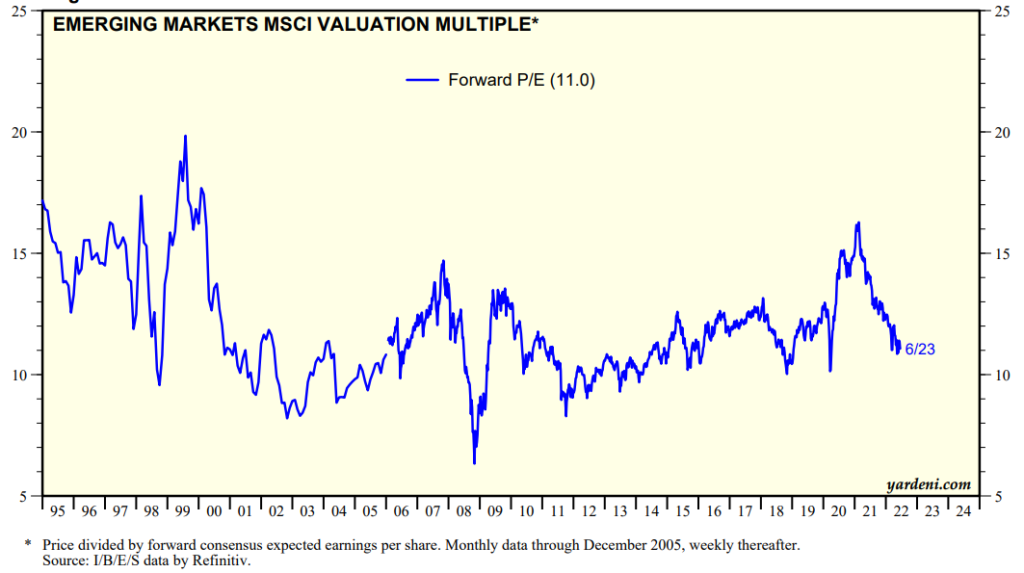
Non-U.S. stocks paint the same picture. Valuations are the lowest they have been in years and offer the opportunity to buy at lower prices.
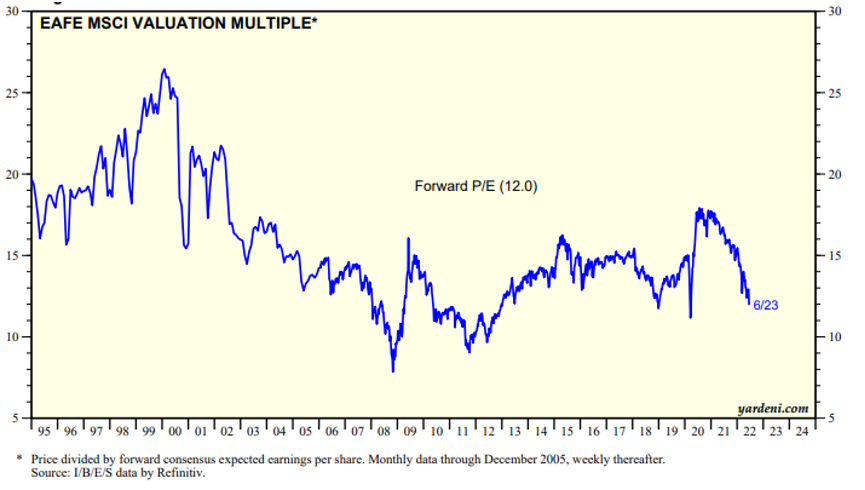
Source: Yardeni Research
Source: Yardeni Research
There are no certainties or guarantees in investing, and there are no promises about what will happen over the next six months. But we believe we are beginning to see reasons for optimism.
If your time horizon is 18 months, this market is still not for you. But if you have a five-year horizon or longer, we think the market backdrop is the most enticing it has been in years.
When everyone is worried about the same things, that creates opportunity. Risk and reward have proven time and again they are an iconic duo – you can’t have one without the other.
Nothing felt like risk during the “go-go” period of 2020-2021 until it became obvious it was. The same may be true now – nothing will feel like an opportunity until it becomes obvious it was.