Row, Row, Row Your Boat
Like Baskin Robbins, diversification offers many flavors:
- By Company (more stocks vs. fewer)
- By Sector/Industry (cyclical vs. defensive)
- By Geography (domestic vs. foreign)
- By Market Capitalization (large companies vs. small)
- By Asset Class (stocks vs. bonds vs. alternatives)
- By Style Factors (value vs. growth vs. quality vs. momentum, et al.)
- By Tax Bucket (taxable vs. tax-deferred vs. tax-exempt)
- By Maturity (short vs. intermediate vs. long)
Not quite 31 flavors, but you get the idea.
These are all levers investors can pull to help mitigate the unwanted risks in their portfolios and isolate the desired ones.
We believe diversification (in all forms) can be incredibly powerful over the long term. It is also guaranteed to create regret, confusion, and frustration in the short run.
The double-edged sword of diversification is best summed up by two quotes:
“Diversification means always having to say you’re sorry.” — Brian Portnoy
“The bottom line is that since diversification is the only free lunch in investing, you might as well eat a lot of it.” — Larry Swedroe
While it may be your only free lunch as an investor, it might not always taste good in the moment. In some markets, we regret every dollar we put into diversifiers. In others we regret every dollar we didn’t put into diversifiers.
The 2010s were a particularly extreme example of a long stretch where many prudent diversification techniques served as nothing but a drag against our collective frame of reference for “the market” – the S&P 500. Large caps dominated small. Growth kicked value’s butt. Technology – and its cousins – were the only game in town.
The last 18 months have witnessed a return to normalcy among some diversifiers – small-cap value, energy stocks, and managed futures, to name a few. Others have been flipped on their heads entirely – hello, bonds!
Yet one area has remained consistently disappointing from one decade to the next: ROW – the rest of the world.
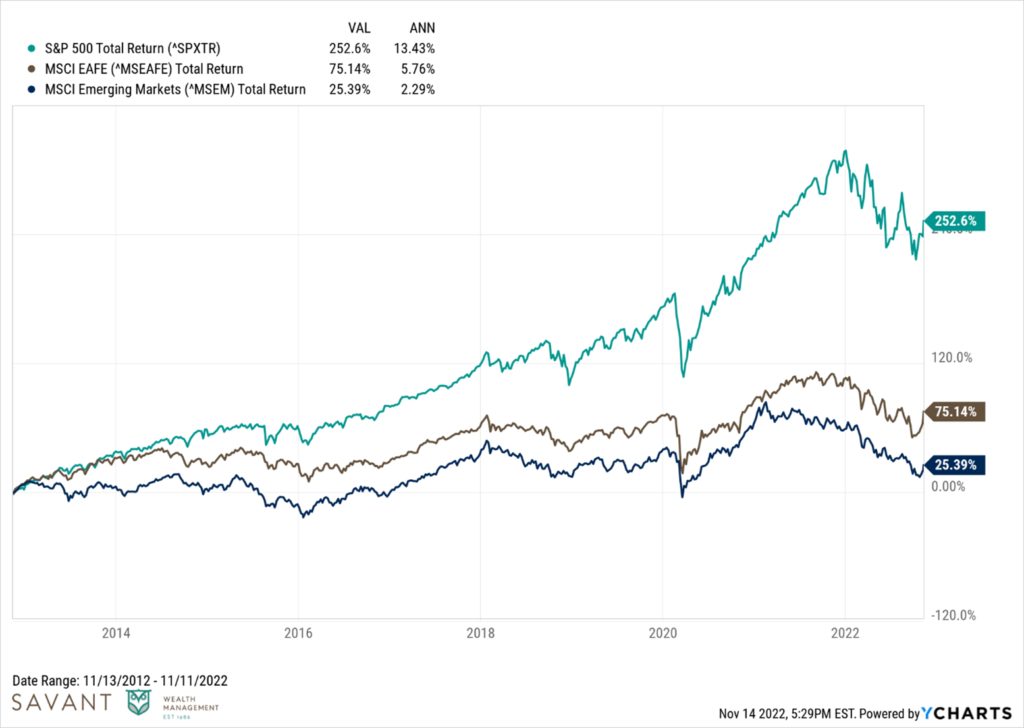
Specifically, I am referring to unhedged exposure to international stocks – from both developed and emerging markets – from the lens of a U.S.-based investor. Even withstanding this year’s bear market, U.S. stocks have experienced unusually high returns over the past ten years – returning 13.43% annualized over the full period. That is well in excess of the ~10% or so that U.S. stocks have generated over the very long run.
International stocks on the other hand? Not so much. Both developed and emerging markets provided U.S.-based investors with low-to-mid single-digit annualized returns over the same stretch. Sure, they didn’t lose money, but the gap between foreign and domestic stocks has been wide enough to drive a truck through.
Instead of mint chocolate chip or butter pecan or even Rocky Road ice cream, global diversification in recent years has tasted like a double scoop of toothpaste and orange juice!
So where do we go from here? Is it time to throw in the towel on international stocks, or are there potential reasons to be excited that the next decade will be a different experience than the last?
As someone who has been espousing the virtues of international diversification for as long as I can remember, I can appreciate that after a while it sounds like a broken record. But we believe many signs can give us optimism that international stocks may have clearer sailing ahead.
Cheap Valuations and Higher Yields
Historically, U.S. stocks have delivered higher earnings growth that their non-U.S. counterparts. And that may continue in the future as well. But international stocks don’t necessarily need to “out earn” the U.S. to win.
There are really three main components to equity returns: earnings growth, dividends, and valuation changes (i.e., expansion or contraction of the P/E multiple).
Research from O’Shaughnessy Asset Management shows that while earnings growth matters a lot to equity market returns, dividends and valuation changes can play a large role as well. While the contribution of valuations changes has been negligible over the very long-term (1871-2021), over shorter horizons – even those a decade or longer – it can make or break stock market returns.
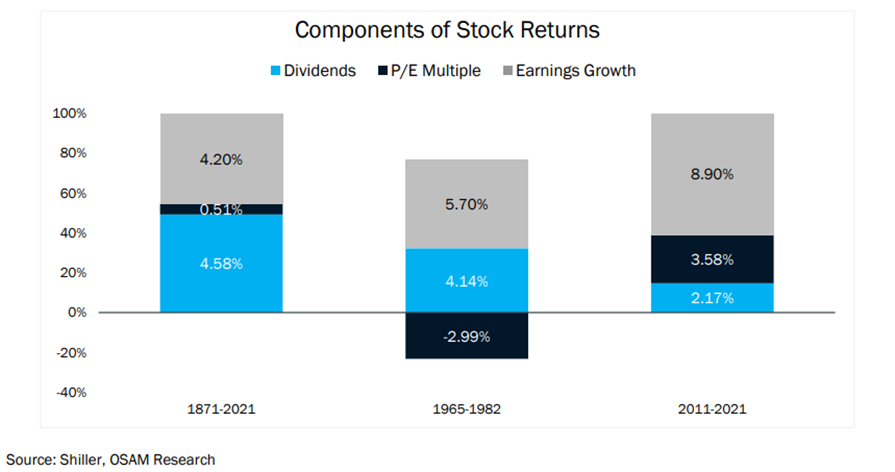
The period from 1965-1982 saw contracting multiples subtract about 3% annually from stock returns whereas expanding multiples in the 2011-2021 bull market added over 3.5% per year, not from fundamentals mind you, but from stocks just getting more expensive.
While our baseline expectation of the impact of valuation changes should be neutral long-term, in the medium-term mean reversion can be quite powerful, serving either as a headwind or a tailwind depending on your starting point.
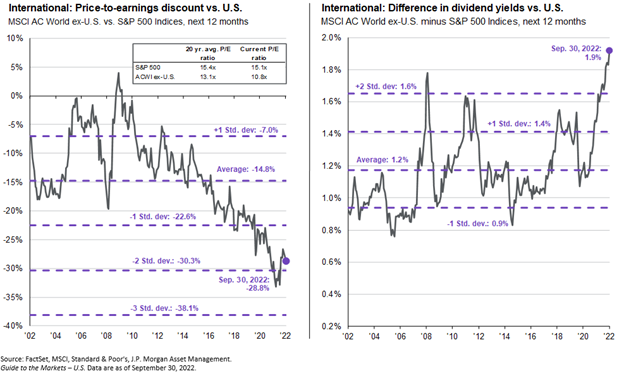
Per J.P. Morgan, international stocks (measured by the MSCI AC World ex-U.S. index) have typically traded at a roughly 15% discount to U.S. stocks over the last 20 years. Today, that valuation difference is closer to 30% – nearly two standard deviations from the norm. On top of that, international stocks sport a sizable dividend advantage as well, with starting yields nearly 2% higher than that of the S&P 500.
International stocks are also trading at highly discounted levels relative to their own histories. The below table from Marquette Associates displays six popular valuation metrics as of October 31st, 2022, for the S&P 500 as well as International Developed Large Caps (MSCI EAFE), International Developed Small Caps (MSCI EAFE SC) and Emerging Markets (MSCI EM). It also highlights the historical percentile across all six measures.
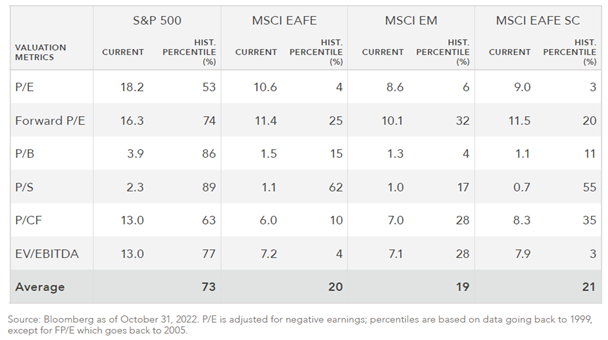
While U.S. stock valuations have come down a bit amid this year’s drawdown, they are still fairly expensive by most measures. Meanwhile, International stocks are trading, on average, within the cheapest quartile levels across all three indices going back to the early 2000s.
Valuation is a blunt timing tool, but the next five-10 years may be offering an attractive entry point.
Two Ways to Potentially Win
When allocating abroad, investors must consider the impact of foreign currency, or FX. Because U.S.-based investors must convert from a stock’s local currency back into dollars, a rising USD can detract from foreign stock returns and vice versa.
Despite changes to exchange rates over time, there is no expected risk premium to be earned for any individual currency. As such, over time their impacts should wash out.
But over shorter periods, they can matter … a lot.
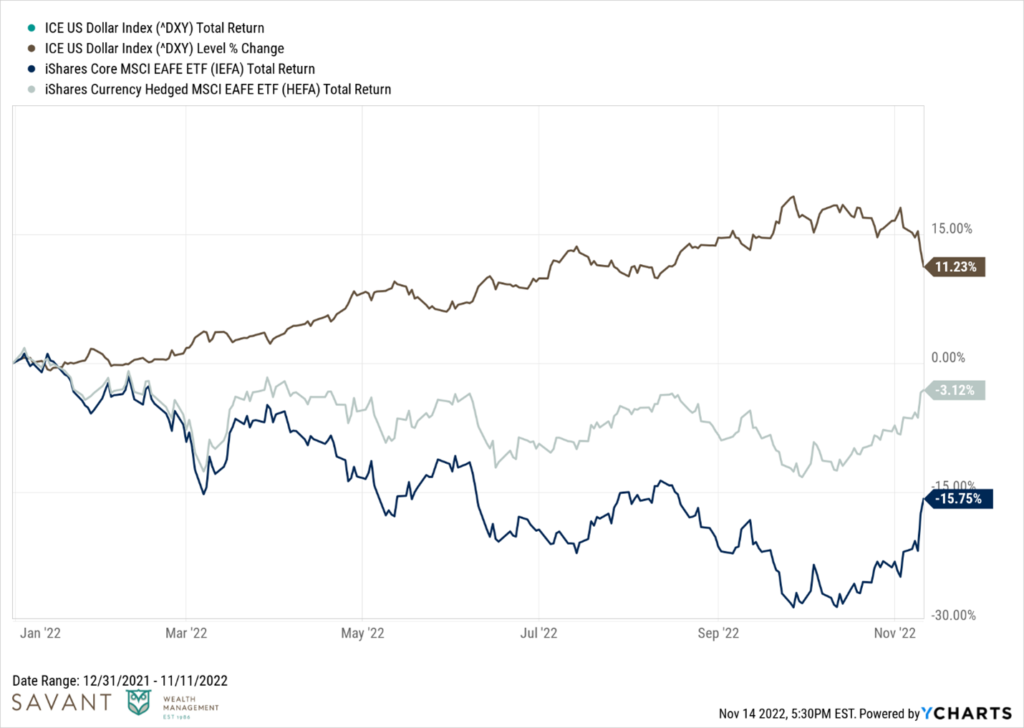
Since 2011, the U.S. Dollar – as measured by the ICE U.S. Dollar Index – has risen nearly 40% against a basket of world currencies. And this year alone, the U.S. Dollar is up over 10%. This, and this alone, has driven to the year-to-date underperformance of developed international stocks.
The below chart plots the rise of the ICE U.S. Dollar Index in 2022 against the returns of two ETFs that track the same underlying index. The only difference between the two ETFs is that one hedges the currency risk, and the other doesn’t. Stripping out the impact of the FX conversion, the MSCI EAFE index is nearly flat for the year.
While the strong dollar has hurt foreign stock returns for U.S. investors this year, currencies often mean revert following extreme movements. The chart below from GMO shows the forward three-year FX return for currencies based on how “cheap” or “expensive” they were at the start of the period. Long story short, extreme moves in one direction are typically followed by strong moves in the other.
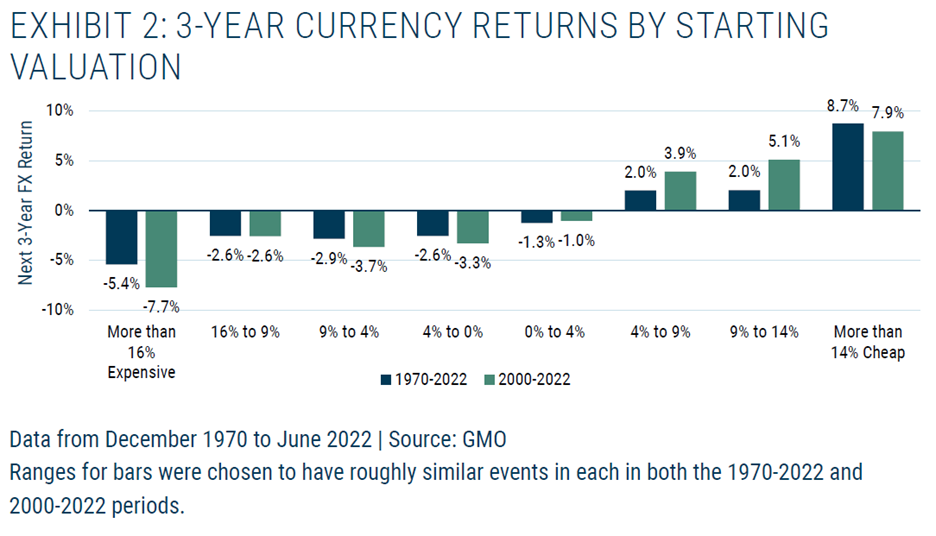
Today’s backdrop – cheap stocks and cheap currencies – gives international equities two ways to win.
Market Cycles
It wasn’t always like this.
International stocks haven’t always underperformed the U.S. Don’t believe me? Look for yourself.
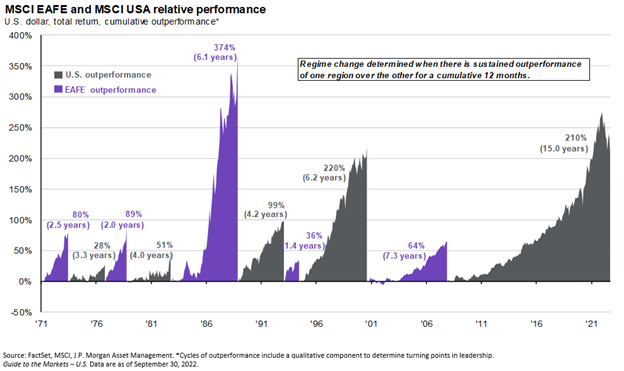
Cycles of relative over- and underperformance are a natural byproduct of markets. It just so happens that this one has been historically long and strong. Like all the changes in leadership before it, it too shall eventually end.
A World of Opportunities
Below is a map of the world, sized by stock market size rather than landmass. At the end of 2021, the U.S. stock market represented 60% of the global market capitalization.
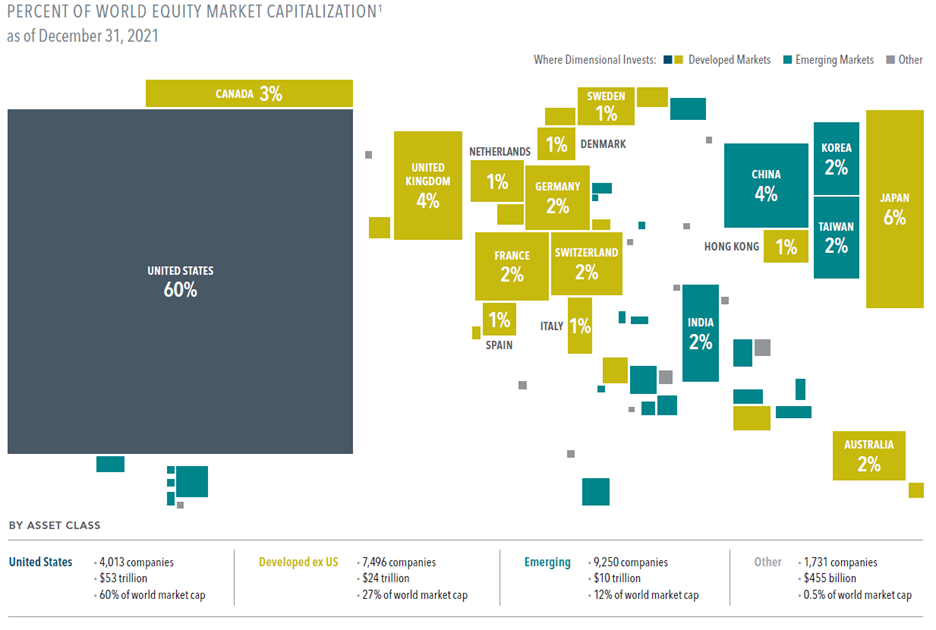
Source: Dimensional Fund Advisors
Our market is by far the largest in the world, but the other 40% of the investable universe represents ownership of thousands of household name publicly traded companies representing over $30 trillion in value.
Risk Management, First and Foremost
The primary purpose of global diversification is not return enhancement. Rather, it is acknowledging that no individual country is immune to prolonged dry spells. We experienced it domestically with the “lost decade” of the 2000s. Japan took over 30 years to recover from its stock market bubble popping in the late 1980s.
Professor Elroy Dimson defines risk as, “more things can happen than will happen.” The world we inhabit is highly uncertain. Diversifying by country and region reduces the risk of having a single point of failure in our portfolios.
That does not imply investing internationally is without risks. But as Jason Zweig notes in a recent Wall Street Journal article:
“The obvious negatives are already priced in: a prolonged war in Ukraine, an acute energy crisis and raging inflation, a brutal recession, floundering currencies.
With pessimism this pervasive, it wouldn’t take many positive surprises to overturn the obvious—and make global diversification lucrative again.”
The U.S. stock market has rewarded investors handsomely in recent years, in absolute and relative terms. We grew accustomed to (relatively) smooth sailing for quite some time, but this year has been a reminder that the waters can always get choppy. If you haven’t yet, now may be the time to consider course correcting and row, row, row your boat gently overseas.
This is intended for informational purposes only and should not be construed as personalized investment advice. Past performance may not be indicative of future results. Different types of investments involve varying degrees of risk.
Historical performance results for investment indices, benchmarks, and/or categories have been provided for general informational/comparison purposes only, and generally do not reflect the deduction of transaction and/or custodial charges, the deduction of an investment management fee, nor the impact of taxes, the incurrence of which would have the effect of decreasing historical performance results.
Due to various factors, including changing market conditions and/or applicable laws, the content may no longer be reflective of current opinions of Savant.