Inflation: Temporary or Here to Stay?
The Hatfields versus The McCoys. Tesla versus Edison. Ali versus Frazier. Jobs versus Gates. All great rivalries throughout history. 2021 created a new rivalry – those who believe inflation is temporary and others who believe it’s more indefinite.
Setting the table, the U.S. inflation rate increased to nearly 5.4% year-over-year as of July 2021, the fastest rate of growth since 2008.
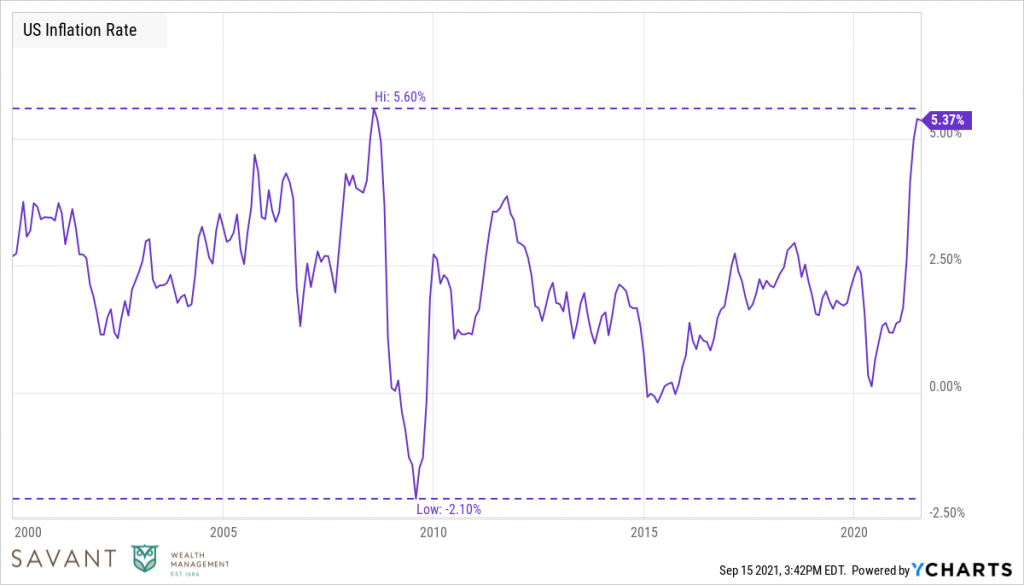
Ycharts: August 2000 – August 2021.
Concern about rising inflation in the next few years has been a major point of contention. In fact, fear of inflation is now the biggest “tail risk” in markets per a Bank of America monthly fund manager survey. Inflation passed COVID-19 as the markets’ largest concern in March 2021 and has held the top spot ever since.
Initially, these anxieties were based on economic theory (read: money printing leads to higher prices) but we have observed significant inflation in:
- Home prices rising to their highest levels in 20 years
- Materials and component prices like semiconductors, lumber, and copper appreciating at their fastest rates in decades
- Used car prices rising dramatically
Looking at individual categories, we can see that inflation has been concentrated in a few areas.
However, many of the categories pushing inflation higher are driven by shortages and a natural consequence of completely stopping and then restarting the economy and global supply chains. The pandemic caused the biggest supply-chain disruption in recent history. It’s not realistic to expect all parts of the global economy to function efficiently coming out of the pandemic.
Add in the stimulus from government support programs and it creates a powerful cocktail for higher prices. Much of the inflation can be attributed to higher spending financed by COVID-19 relief that resulted in a historic rise in consumer wealth and savings. Dating back to 1945, the U.S. personal savings rate had never been higher than it was last year.
This is one reason to believe inflation could be temporary: stimulus dollars can’t produce elevated spending forever. This theory seems to be playing out; from its peak last year, the U.S. personal savings rate has been drawn down by more than half, falling from a peak of 26.1% to 10.3% in the most recent quarter.
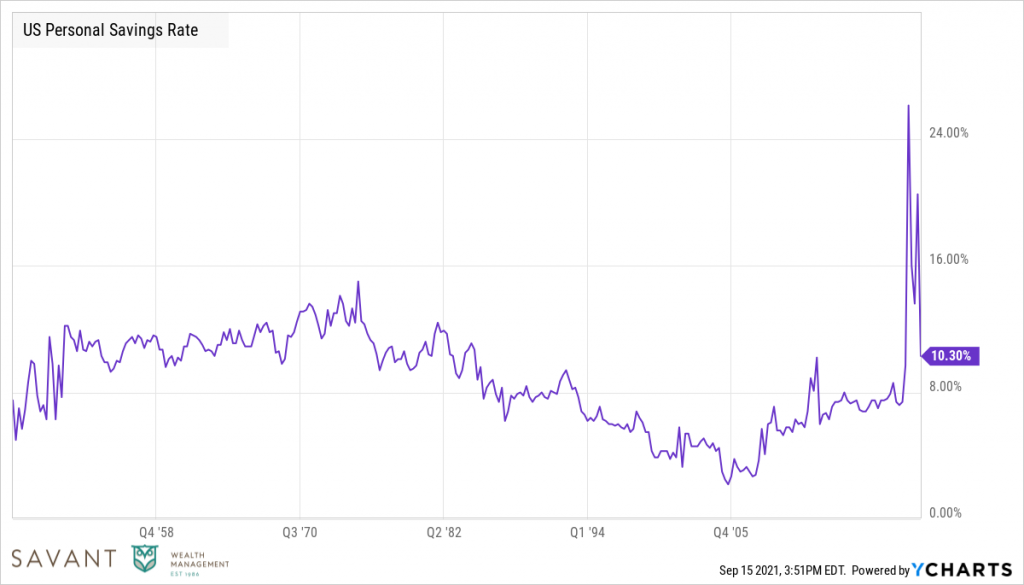
Y-Charts: January 1947 – August 2021.
Looking at individual categories, we can see that inflation has been concentrated in a few areas.
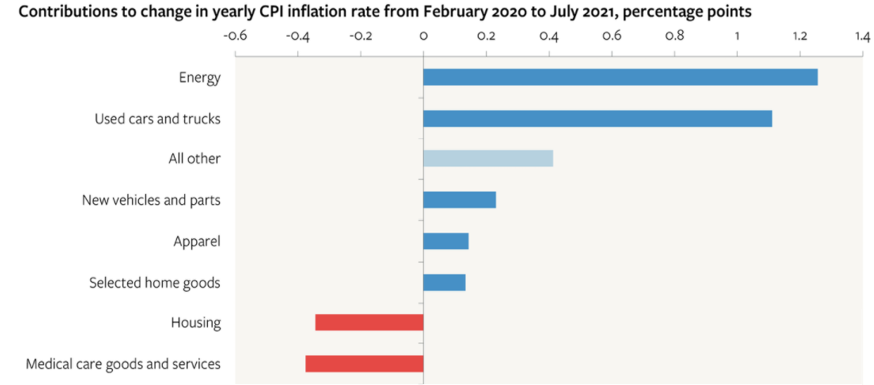
Source: Bureau of Labor Statistics
The biggest contributors have been oil prices and new and used cars and trucks – both areas hit hard by the pandemic. Recent evidence suggests the drivers of those price gains may be fading:
- Gasoline prices are up 42% versus last year. In the first three months of 2021, monthly growth rates were between 7% and 10%. In the four months since, growth rates have slowed significantly, rising by less than 1% since April 2021.
- Lumber prices rose from a price of $259 at the April 2020 lows – when nobody thought there would be demand for new homes – to a price of $1,514 at the May 2021 high when demand for new homes became apparent. Since May, the price of lumber has fallen roughly 65% to $521 and we no longer hear much about its contribution to inflation.
- Used car prices rose 42% over the last year, but they increased just 0.2% from June to July.
- Airfares rose 19% over the past year, but they declined 0.1% between June and July.
And while inflation, as measured by Consumer Price Index (CPI), has been printing its hottest numbers in over a decade, the market does not appear to believe that inflation is here to stay. The 10-year breakeven inflation rate uses market prices to estimate the consensus forward-looking inflation rate of all market participants. Meanwhile, the CPI measures month-to-month changes in the price of a basket of goods relative to that same basket a year ago. While the CPI has surged in recent months, the expected forward-looking inflation has only subtly nudged higher. Based on this, the market does not appear to believe prolonged inflation is a likely threat at this time.
Interestingly, we can look back to the Great Financial Crisis (2007-2009) and see that over shorter periods, the CPI also diverged from longer-term expectations only to revert closer to the longer-term estimates in the years that follow.
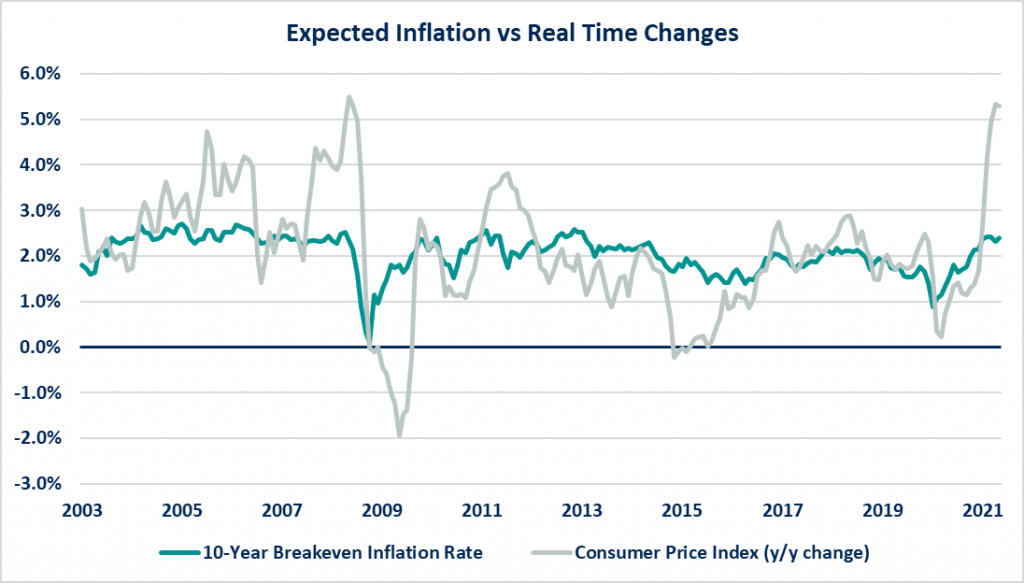
Source: FRED.
What If Inflation is Not Fading?
If inflation remains temporary as the Fed expects, the average investor may not even notice aside from a couple of extra mentions on CNBC. But persistent, prolonged inflation could negatively impact not only investors but almost everyone. Even with data seeming to indicate softer inflation, it is important to consider our defenses in case these trends reverse. By looking to the not so distant past, we can see what buffered portfolios when inflation checked in at 9.3% per year between 1/1973 and 6/1980.
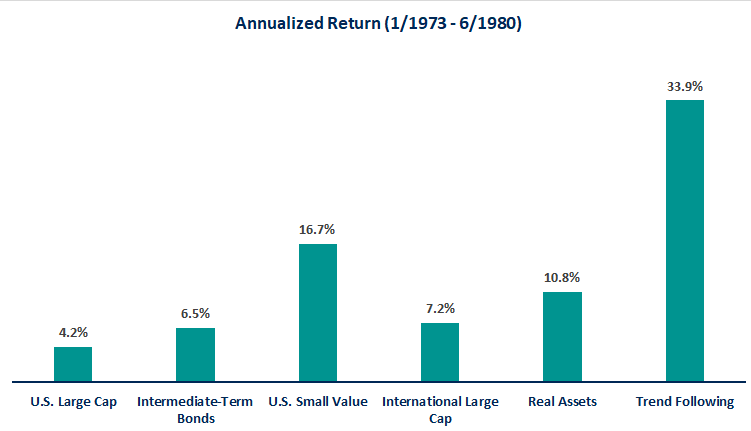
Source: Morningstar Direct.
In the last major bout with inflation, investors were able to find some cover by supplementing traditional U.S. large cap and intermediate-term bond allocations with small value and international stocks in addition to alternatives such as real assets and trend following. While minor tilts towards these asset classes may not have had a direct impact on prices at the pump or home improvement retailers, they would have helped preserve the purchasing power of one’s portfolio.

Source: Morningstar Direct. Basic benchmark is allocated as follows: 36% S&P 500, 24% MSCI EAFE, 20% Bloomberg US Treasury Bills, 20% Bloomberg US Govt/Credit Interm. Diversified benchmark is allocated as follows: 12.3% Fama-French Large Value, 9.7% Bloomberg US Govt/Credit Interm, 17.2% S&P 500, 6.5% MSCI EM (Appended), 6.5% JPM GBI Global Ex-US Hdg (Appended), 5.2% IA SBBI US 1 Yr Trsy Const Mat, 4.9% Fama-French Small Value, 4.2% MSCI EAFE Value, 3.8% SwissRe Global Cat Bond (Appended), 3.8% Credit Suisse Mgd Fut Liquid (Appended), 3.8% Dimensional International Small Cap Index, 3.8% Dimensional International Small Value Index, 6.2% FTSE Nareit All Equity REIT, 3.3% MSCI EAFE, 3.0% Bloomberg US Credit Baa, 2.5% IA SBBI US Small Stock, 1.6% Fama-French US High Profitability, 1.6% Fama-French High Prior Return.
The basic benchmark, which includes U.S. and international stocks along with short- and intermediate-term bonds, struggled when adjusted for inflation. In fact, investors in the basic portfolio would have lost almost 20% of their purchasing power over this time frame. But with a few minor tweaks, the outcome would have changed drastically! Diversified investors tilt towards small and value stocks, enhance their bond allocations, and incorporate alternative investments into this benchmark. While the results may not be overly exciting, these investors would have increased their purchasing power by over 12% during this period.
Regardless of whether you are already retired or if retirement is 40 years away, investing is the art of delayed gratification. Put simply, by investing today, one hopes to increase purchasing power down the road. The data seems to be indicating that the pockets of inflation seen in the past few months may be transitory and fleeting. But by examining the evidence, we can build a robust portfolio meant to succeed in good times but also to weather the storm. After all, watching the Hatfields and McCoys in their latest battle is much more entertaining when your family’s prosperity isn’t at risk.