Challenge Conventional Wisdom
Step One of Evidence-Based Investing
Evidence-based investing (EBI) is the foundation of our investment philosophy. It’s designed to better evaluate the challenges faced by investors today and pushes back on the wisdom of conventional investment advice. We believe all financial advice should be made in the best interest of the client, and EBI serves as a decision-making framework that makes this possible.
Conventional investment wisdom often tries to answer questions that cannot be validated. For example, is there irrefutable proof that one political party has more influence over the market than the other? Or, did the market decline today because of the trade tensions between the U.S. and China?
There is no way to verify a positive or negative response to either of these questions. And with the influence of headline news at an all-time high, it brings to light the importance of challenging conventional wisdom.
EBI evaluates the concerns brought on by traditional wisdom by answering questions in a systematic, analytical, and scientific manner. The goal of EBI is to maximize return and reduce risk through a four-step process.

Which brings us to the first step of evidence-based investing: challenge conventional wisdom.
We challenge conventional wisdom by addressing specific questions. With this as the first step in the EBI process, we make it clear that the conventional approach to investing adds unnecessary risks and costs. We ultimately arrive at conclusions regarding four broad areas: asset allocation, active management, market timing, and costs/taxes. These results inform the key pillars of our investment philosophy.
Asset Allocation
Question: What is the best way to capture market returns?
Answer: Most salespeople on Wall Street believe that successful investing is about “beating the market.” They do this using an active investing approach that involves regularly making buy and sell decisions. Evidence demonstrates that this belief has no foundation on which it can stand. Attempts to beat the market, add unnecessary risk and expense, and usually deliver a lower overall return relative to more passive approaches. This may be counter-intuitive for many people, but the evidence is overwhelming. We believe the most efficient way to capture market returns is through strategic asset allocation. This is a long-term, targeted approach that combines a variety of asset classes (i.e., stocks, bonds, alternatives, cash) in a portfolio to reap the highest returns for a given level of risk. The specific mix of assets is based on the individual investor’s goals and risk preferences. With an optimal asset allocation, investors let the markets do the work for them.
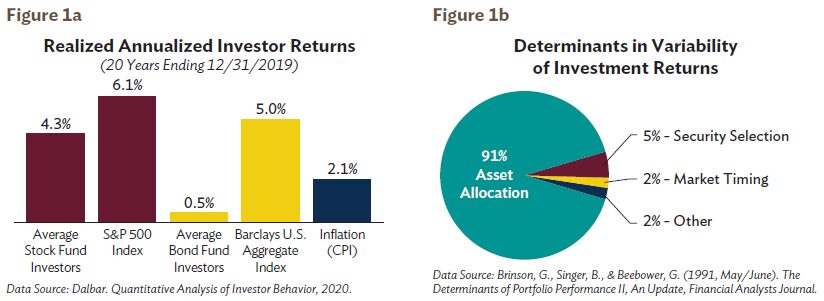
The Evidence: A study by Dalbar (Figure 1a) shows that conventional active money management techniques resulted in substantially lower returns for investors. This is the result of both active managers underperforming their benchmarks and individual investors underperforming the funds they own through bad timing. As Figure 1b shows, research demonstrates that over 90% of the total return variations across portfolios were the result of asset allocation differences. Other decisions such as security selection and market timing accounted for only 5% and 2%, respectively.
Active Management
Question: Do professional money managers perform better than market indexes?
Answer: Money managers are notorious for overtrading and executing a variety of strategies and techniques in the pursuit of market-beating returns. Unfortunately, the evidence demonstrates that more activity does not necessarily equate with better results. The actions of money managers can be best measured in terms of cost. Both explicit (published in the prospectus) and implicit (hidden or not disclosed) costs make it very difficult for money managers to outperform their benchmarks.
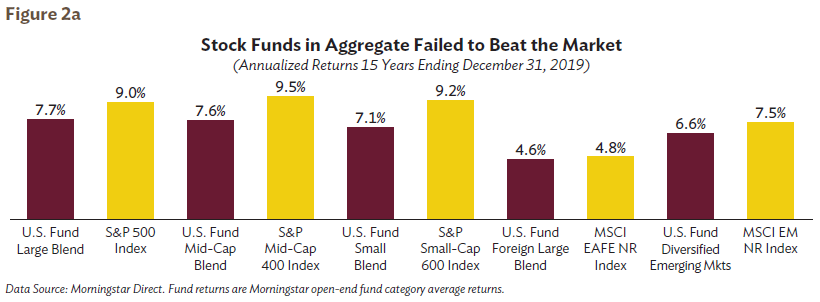
The Evidence: Figure 2a shows how the average actively managed stock funds in a variety of stock categories lagged their benchmark indexes over a 15-year period ending December 31, 2019 – evidence that money managers do not perform better than market indexes.
Question: Can you beat the market by identifying great money managers?
Answer: In short, the odds are stacked against you – and here’s why. We’ve established that the average actively managed stock fund typically falls short of benchmark indexes (Figure 2a). But for many investors, this evidence does not stop them from continuing their quest to beat the market by picking the right funds. Their strategy relies on selecting only the best money managers – ones with top track records over five- or 10-year return histories. It’s for this reason that the Securities and Exchange Commission (SEC) mandated that every mutual fund prospectus disclose that “past performance is not indicative of future returns. Performance chasing (both in money managers and the market) is like driving a car while only looking in the rearview mirror. There is no data supporting a positive correlation between superior past performance and future returns.
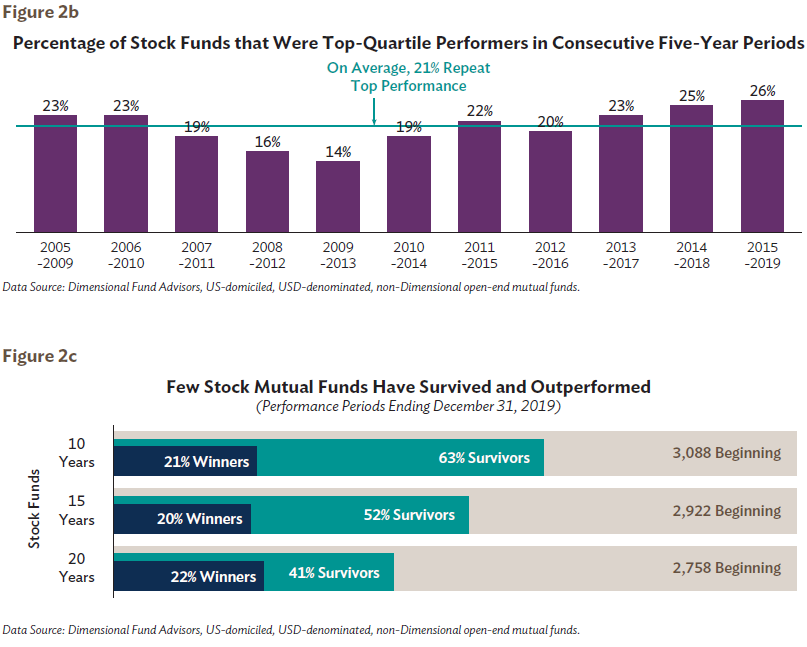
The Evidence: Figure 2b shows how few top-quartile stock funds were able to maintain a top-quartile ranking over the following five years. On average, only 21% of the managers were able to remain in the top quartile in consecutive five-year periods. Notice the range of money managers’ annual repeat successes—from 14% to 26%. Such a low range points to the random nature of a money manager’s success and the difficulty of consistently beating the market. In addition, Figure 2c shows that if one attempts to actively select stock funds, there is a good possibility that the fund will not even exist in 15 years, with only 52% surviving that long going back to 2005.
Market Timing
Question: Can market timing improve returns?
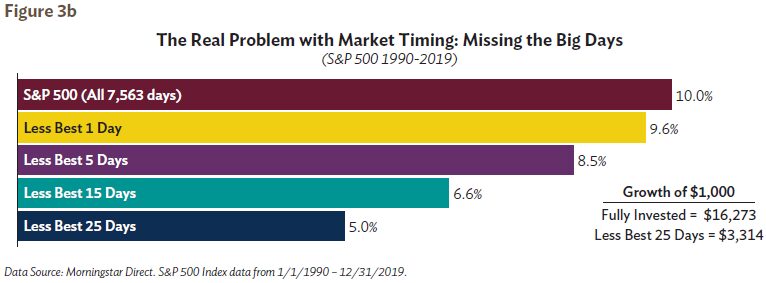
Answer: The simple answer is no. Market timing adds risks and can be extremely costly. For example, from 2005-2007, international stocks were among the top performing asset classes. Enter the bear market and global financial crisis of 2008, when international stocks were affected the most. At that time, those investors who attempted to time the market suffered major losses.
The Evidence: Stock returns come in concentrated pockets of time, as shown in Figure 3b. The S&P 500 Index has had an annual average return of 10% since 1990. However, by missing the best 25 trading days over that period, the return drops to only 5%. Even missing the best five days cost 1.5% in average annual return. The lesson here is that bad timing can have a major impact on your results.
Costs and Taxes
Question: Can investors overcome the fees charged and tax liabilities generated by money managers?
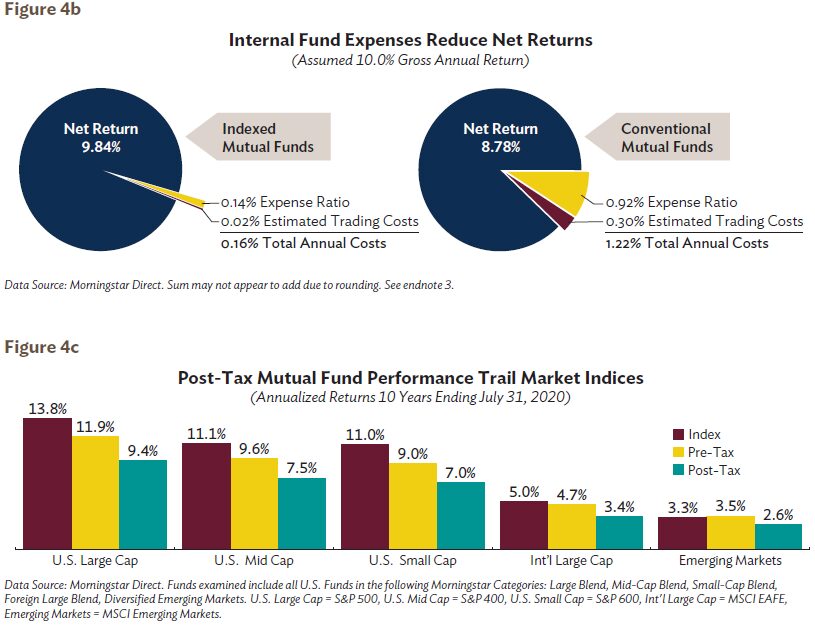
Answer: There is an inverse relationship between fund expenses and returns. In addition to the inherently higher management fees charged by active managers, higher turnover approaches also generally result in higher trading costs and a larger tax bill in the form of capital gains distributions. These added frictions create a high hurdle for active managers to overcome in order to match or exceed similar indexed strategies.
The Evidence: Figure 4b illustrates that the average money manager would need to beat the index by over 1.0% annually just to overcome the higher expense ratios and trading costs. Figure 4c shows how taxes can be a significant additional drag on performance. The average fund trailed its benchmark index across multiple categories even before taxes. After taxes are considered, the picture is even worse. This evidence proves investors are not likely to overcome the fees charged and tax liabilities generated by money managers.
In Summary
By addressing these questions, we’ve concluded that:
- Conventional investment wisdom tries to answer questions that cannot be validated.
- Market timing is a recipe for disappointment.
- Active stock-picking, in aggregate, is unlikely to deliver value.
- Frictions such as high costs and unnecessary taxes can erode returns over time, causing even many “winners” to fail.
- There is no evidence in the persistence of past performance in funds.
Our goal is to simplify your life while maximizing return and reducing risk. We believe the evidence-based investing approach allows us to identify which investments are more likely to succeed – for you.
This brings to light the importance of asking meaningful questions – ones that can be proven or disproven and that are significant to you, the individual investor. In step two of the EBI process, we help answer these questions, providing the foundation for the portfolios we implement for individual investors.
For more information, download our EBI whitepaper or consult with your financial advisor.
3] Expense ratio of 0.14% reflects the cost of the Vanguard Total Stock Market Index (Investor Class). Transaction costs are estimated at 0.5% per annum per 100% portfolio turnover, with turnover of 4% for index funds (based on the Vanguard Total Stock Market Index) and 60% for conventional funds (based on the U.S. Large Cap category average). Data from Morningstar Direct as of 12/31/2019.