Goalposts in Motion

“Just when they think they got the answers, I change the questions.” – “Rowdy” Roddy Piper
“Laces out, Dan!” – Lois Einhorn/Ray Finkle, Ace Ventura: Pet Detective
This should be obvious, but I’ll say it anyway: Kicking field goals in the NFL is a hard job.
And I’m not even talking about the long ones. Even the so-called “chip shot” short-distance field goals are a feat neither you nor I could achieve with any degree of consistency.
There’s a reason we can only name a handful of legendary NFL kickers off the top of our heads – they’re rare. Not a lot of household names in the bunch. And that’s not a knock on the lot of them. It takes an incredible amount of natural talent and hard work to even make it to that level.
It’s one thing to nail 50-yard field goal after 50-yard field goal during practice. It’s a whole other thing to do it when the game is on the line, under inclement weather conditions, or with 40,000 people screaming at the top of their lungs. Almost none of the credit if they split the uprights, and nearly all the blame when it bounces off.
As difficult as the job can be, imagine how much more challenging it would be if, amid the already insane amount of pressure, the goalposts themselves were moving left and right as you aimed your kick. Think of how this extra wrinkle would add to an already complex game. I doubt the NFL will ever introduce this feature (the XFL I’m not so sure of).
As unlikely as it would be to witness moving goalposts in professional football, it is all too commonplace in investing.
What do I mean exactly?
There is a lot of data out there, and you can often transform it to fit your existing narrative by simply altering the start and/or end dates of a data set.
This is referred to as endpoint bias. Institutional investment consultant Meketa Investment Group recently wrote a report describing this phenomenon:
“Statistically, endpoint bias refers to the inclusion or exclusion of data that significantly influence results. Practically speaking, endpoint bias refers to investors’ tendency to place undue significance on results for measurement periods ending in the present. If the recent past witnessed unusually high or low returns, then long term results can change considerably.”
The paper cites several examples, including the following: They looked at the 20-year annualized returns of stocks and bonds, using the S&P 500 and the Bloomberg Aggregate Bond indices respectively. That’s two decades – a long-term period by anyone’s definition.
But these aren’t just any 20-year periods – they are, in fact, quite distinct. One period ends in February 2008 (right before the Financial Crisis) and the other ends in February 2009 (in the immediate aftermath.)

Source: Meketa Investment Group
The first period looks quite normal. Stocks earned roughly their long-term average of around 10 percent. And they outperformed bonds by about 3% per year, earning the expected “equity risk premium” that we have all come to know and love. You know, Stocks For the Long Run!
The second period is where things get interesting. By merely fast forwarding a year, with new start and endpoints, stocks reveal 20-year underperformance to bonds. To call this a rarity would be an understatement.
I think we could all agree that the takeaway for investors in March of 2009 was not that bonds should be expected to outperform stocks over time. It just demonstrates the lack of certainty over any period in financial markets and the difference between improbable and impossible.
Other examples abound that highlight endpoint bias and the havoc it can wreak on our behavior.
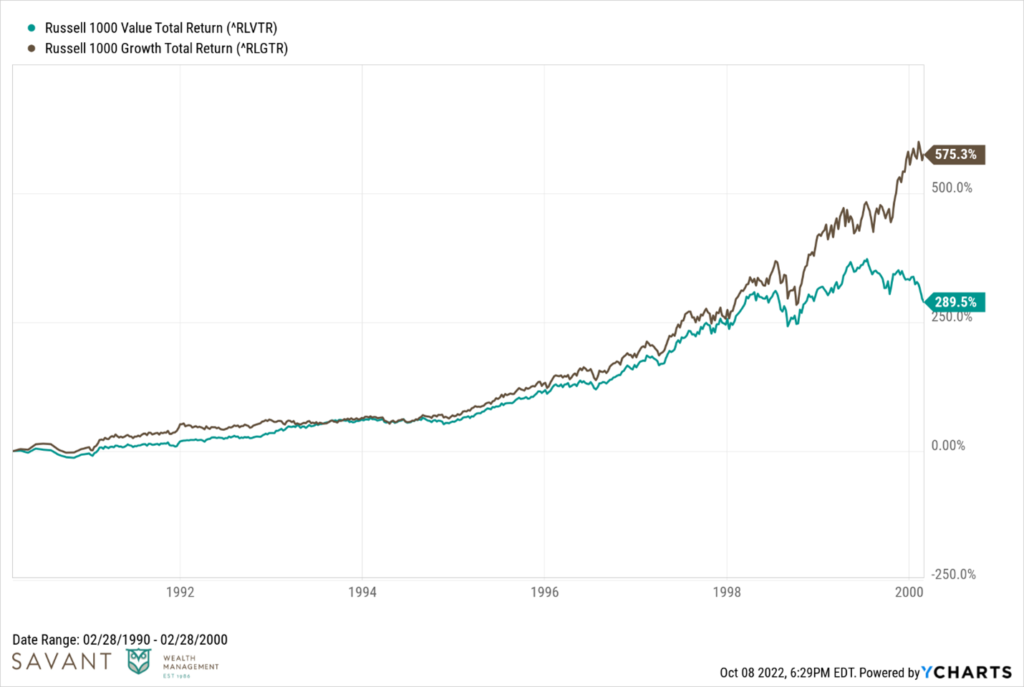
For the 10-year period ending February 28, 2000, growth stocks held a significant lead over their value stock counterparts. An almost insurmountable lead, one might think.

Well, just move the goalposts one year forward and voilà! Value stocks took the lead for the 10-year period ending February 28, 2001.

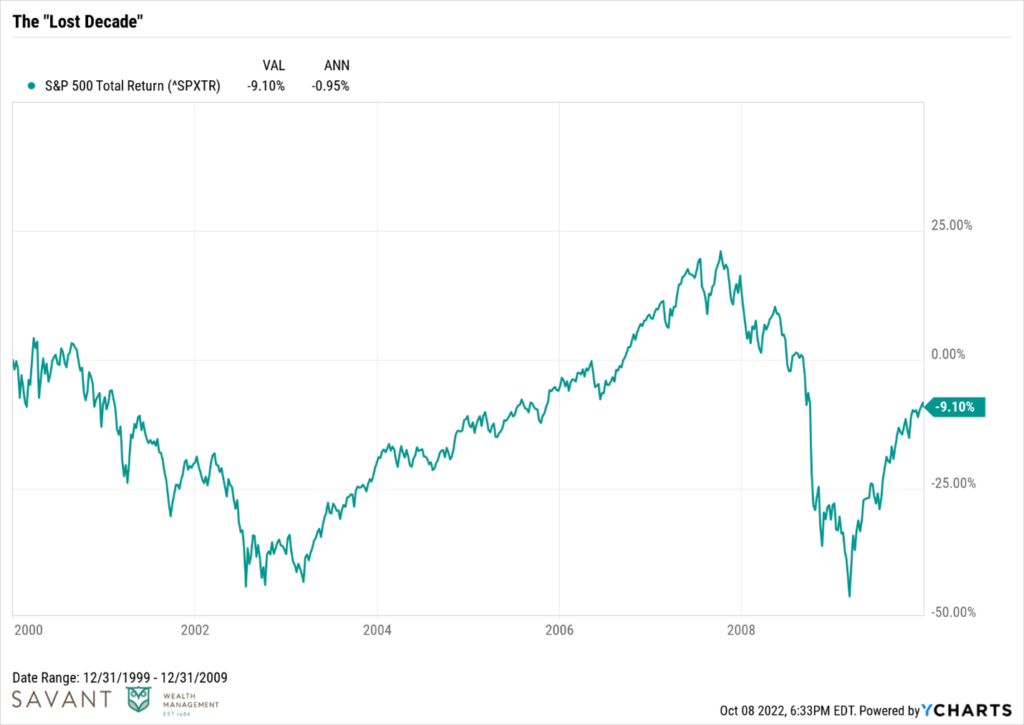
We all remember the famous “lost decade” phrase for the S&P 500 that was repeated ad nauseum in the early 2010s. Ten years in U.S. Large Cap stocks with nothing to show for it. It seems almost laughable now considering the superb returns in this asset class over the last 12+ years since this saying was actually accurate.

That’s just one of many examples where the long-term data do not tell the full story. The last thing you should have been doing in early 2009 was abandoning U.S. stocks. And yet, that is what many people did, capitulating and missing out on a big chunk of one of the great bull markets of our lifetimes.
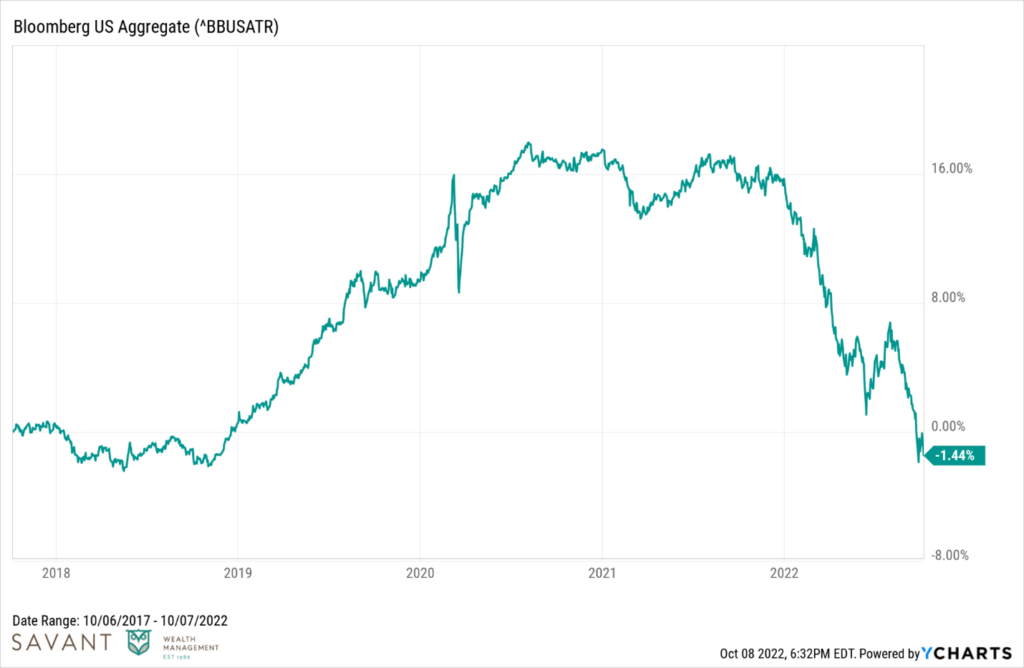
Which brings us to today’s persona non grata – bonds. Fixed income, as measured by the Bloomberg U.S. Aggregate Bond Index, is now showing a negative five-year total return. That’s not a typo. But it is something I never thought I would type.

The sad part is that many investors are taking that as a signal to run away from bonds when they should potentially consider running toward them. Read here for our opinion on the forward-looking prospects for fixed income.
Today’s endpoint paints a lousy five-year experience. We believe today’s starting point provides a glimmer of hope.
This year has been ugly with a capital “U.”
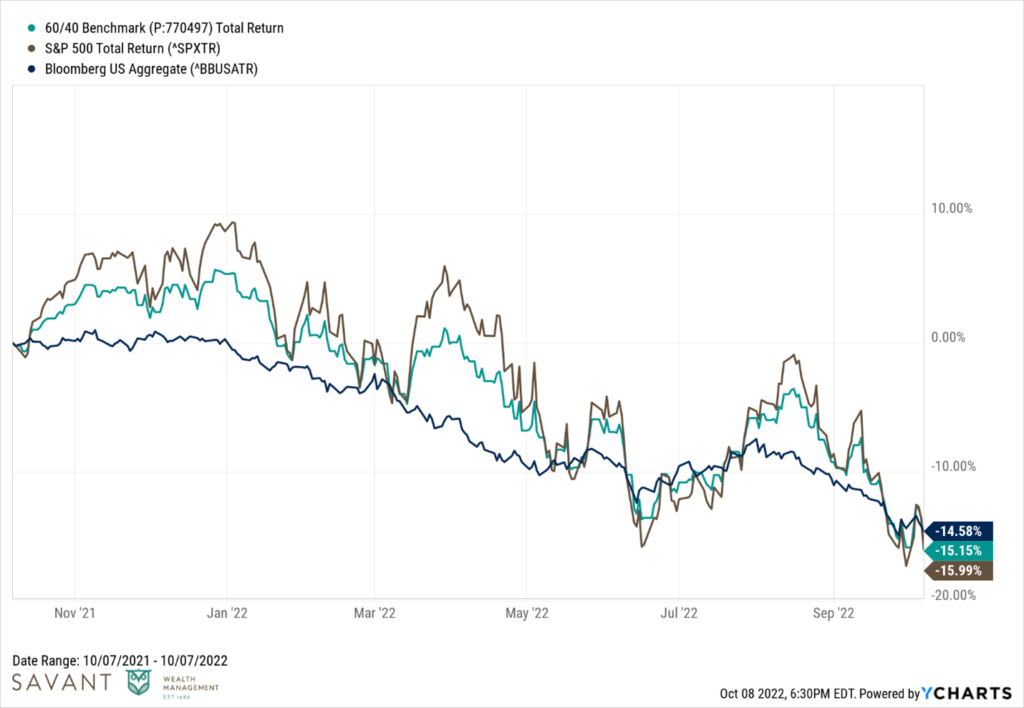
Stocks and bonds down double digits year-over-year have not been fun for anybody. Three straight quarters of losses are bound to test the patience of many.

While understandably easier said than done, be patient. Eventually, capital markets will do what they do best.
Equity valuations will find an equilibrium. Volatility will subside. Credit spreads will normalize. Corporations will continue to grow earnings, pay dividends, and allocate capital to its highest and best use. Bonds, now higher yielding, will over time distribute enough interest income to recover today’s paper losses.
All in due time.
Until that happens, and we can’t know when, understand that even long-term returns can be heavily influenced by periods of extreme weakness or strength. This makes it easy to draw conclusions where there aren’t any.
So how do we combat endpoint bias?
Going back to the research from Meketa, they provide four recommendations:
- Examine the longest time period available.
- Examine periods that contain a variety of market and economic conditions.
- Examine sub-periods and look for cyclicality.
- Examine the underlying drivers of asset class returns.
Said differently, when you think you’ve got the answers, start changing the questions.
This is intended for informational purposes only and should not be construed as personalized investment advice.
Historical performance results for investment indices, benchmarks, and/or categories have been provided for general informational/comparison purposes only, and generally do not reflect the deduction of transaction and/or custodial charges, the deduction of an investment management fee, nor the impact of taxes, the incurrence of which would have the effect of decreasing historical performance results.
